Monthly Report: New Constructions in Chiba See a 134% Sales Volume Surge, with an Initial Contract Rate of 78.9%A · FULL TRANSLATION
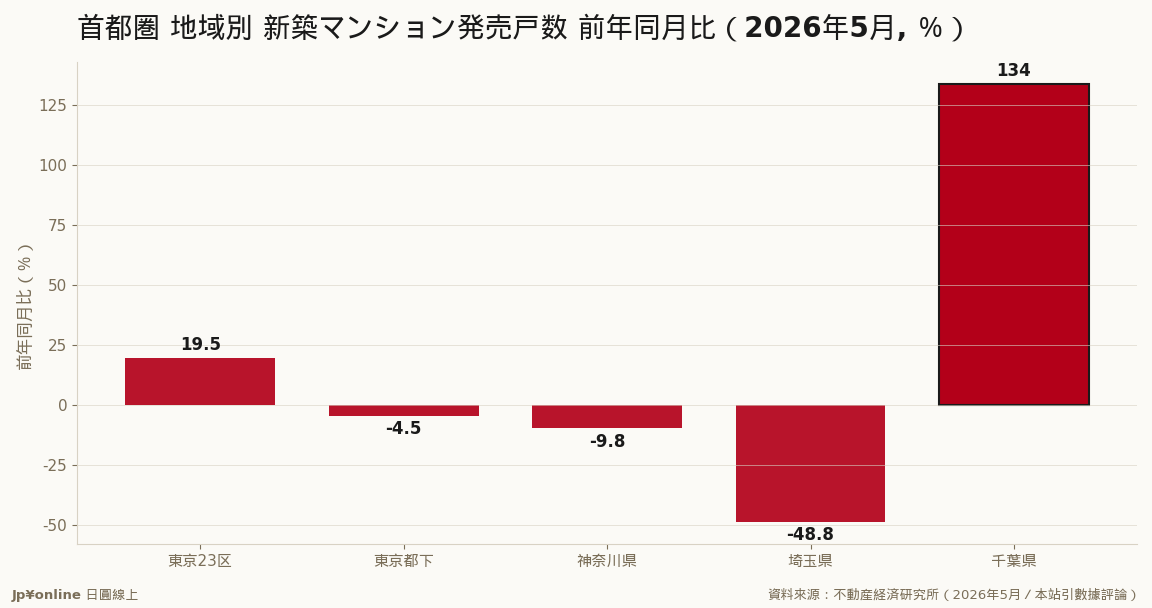
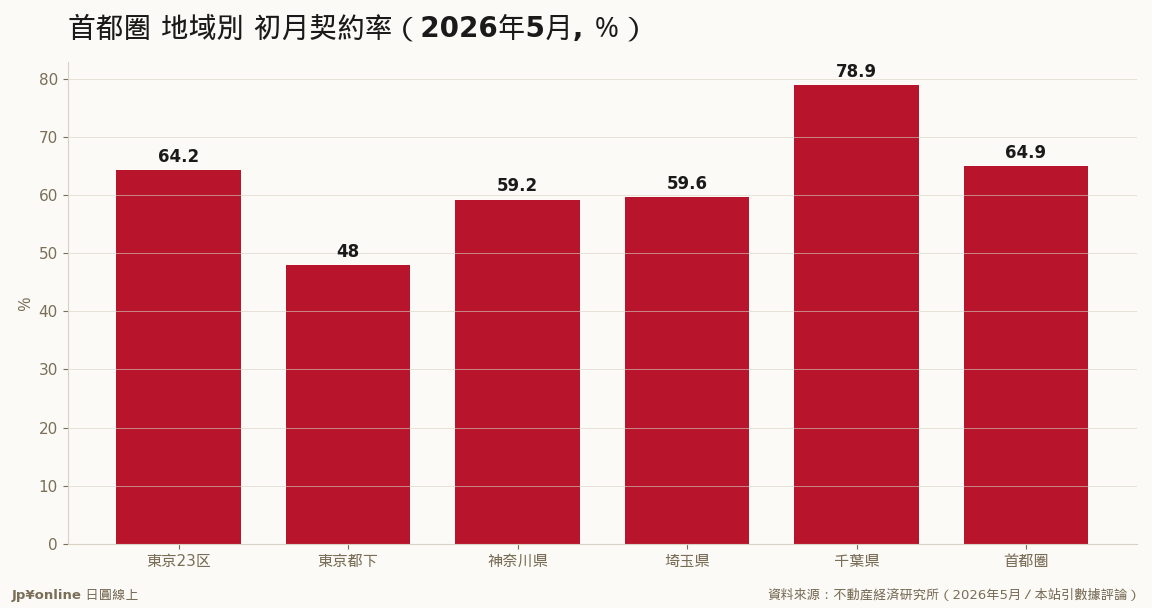
- Chiba saw a 133.8% increase in new construction units sold and an initial contract rate of 78.9%
- Only Chiba among all areas had positive sales volume growth, while Saitama, Kanagawa, and Downtown Tokyo experienced declines
- Chiba’s initial contract rate is significantly higher than the Greater Tokyo Area’s overall rate; downtown areas show mixed results
- Initial contract rates are a more accurate gauge of demand compared to price levels
In the latest report from Real Estate Economic Institute for May, sales volumes are higher outside Tokyo than within it: in Chiba, there were 360 new construction units sold (up 133.8% year-on-year and the only area in the Greater Tokyo Area to double), with an initial contract rate of 78.9% (up 28.9 percentage points, the fastest among all five areas). The year-over-year growth rates for sales volumes are as follows: Chiba +133.8%, Central Tokyo +19.5%, negative in Saitama (-48.8%), Kanagawa (-9.8%), and Downtown Tokyo (-4.5%). Initial contract rates are 78.9% in Chiba (up significantly), far higher than the Greater Tokyo Area’s overall rate of 64.9%; Central Tokyo stands at 64.2%, Kanagawa at 59.2%, Saitama at 59.6%, and Downtown Tokyo at just 48.0% (the only area below the 70% break-even point).
【Why Taiwanese Readers Should Care】In May’s Real Estate Economic Institute report, sales volumes outside of Tokyo have overtaken those within: Chiba is leading with a 133.8% increase in new construction units sold (the only area to double) and an initial contract rate of 78.9% (28.9 percentage points higher than last year), the fastest among all five regions. For Taiwanese readers, this is evidence that demand has spilled over from Tokyo’s core: as prices in the central areas hit ¥1 million per tsubo [approximately 3.3 square meters], buyers are looking for more affordable options within commuting distance.
【Numbers Breakdown】First, consider the supply extremes. The year-over-year growth rates for sales volumes were positive only in Chiba (+133.8%) and Central Tokyo (+19.5%), while Saitama (-48.8%), Kanagawa (-9.8%), and Downtown Tokyo (-4.5%) saw declines. A doubling of supply indicates developers are pushing projects into areas with better sales prospects. Next, look at how quickly they sold—initial contract rates (the percentage of units sold in the first month, 70% being a break-even threshold).
Chiba led the pack with an initial rate of 78.9%, far above the Greater Tokyo Area’s overall rate of 64.9%; Central Tokyo at 64.2%, Kanagawa at 59.2%, Saitama at 59.6%, and Downtown Tokyo at just 48.0% (the only area below the break-even line). Combining supply with initial contract rates, Chiba stands out for its strong performance in both volume and speed of sales, while Central Tokyo has seen steady growth despite higher volumes, whereas Saitama struggles with lower volumes but is on the edge of breaking even.
【A Unique Methodology: Initial Contract Rate as a Demand Thermometer】Many focus solely on prices when analyzing real estate markets, but price is a lagging indicator—developers can maintain high prices for long periods. The true measure of demand is initial contract rates: this metric gauges how many units were sold in the first month, with 70% being the break-even point. In May, Chiba’s rate of 78.9% indicates strong and urgent buyer interest (up nearly 29 percentage points from last year), while Downtown Tokyo at 48.0% suggests cooling demand in more peripheral areas. To assess a market’s value, look at whether its initial contract rate is above or below the 70% threshold.
【Practical Advice for Taiwanese Readers】First, use initial contract rates as a demand thermometer: regions with rates over 70% are hot markets, while those around 50% are riskier. This approach provides an earlier indication of genuine buyer interest than price alone. Second, Chiba’s surge demonstrates the spillover effect from Tokyo’s high prices—budget-conscious buyers can explore more affordable options in Chiba and Kanagawa along commuting routes where demand is already validated. Third, avoid interpreting a single month's 133.8% increase as a trend; such high figures could result from concentrated large-scale launches. Monitor trends over two to three months before determining if it’s a structural spillover.
【Next Steps】Watch whether Chiba’s strong sales continue and whether Saitama’s reduced supply is due to developer strategy or weakening demand. Also, monitor how the coldest region (Downtown Tokyo at 48%) may affect broader market trends in the Greater Tokyo Area.