Japan’s Trade Surpasses Historical High in 2025 Calendar Year, But Trade Deficit Narrows—Key Drivers Are Cheaper Energy BillsA · FULL TRANSLATION
- Trade in Heisei 7 (2025 calendar year): Exports reached ¥110.4 trillion (+3.1%, highest in history and consecutive 5-year increase)/Imports stood at ¥113.3301 trillion (+0.5%)/Trade deficit was ¥2.9296 trillion, still negative but significantly narrowed from ¥5.6325 trillion the previous year (47.9% decrease)
- Cheaper energy bills are key drivers for narrowing trade deficit: Fuel imports totaling ¥22.1450 trillion fell 13.2% (-3.0 percentage points contribution), mainly from crude oil -11.5%, liquefied natural gas -8.5%, and coal -26.2%
- Export momentum shifts from vehicles to semiconductor chain: Semiconductors and related electronic components grew 8.4% to ¥6.588 trillion, while auto exports fell 1.7% to ¥17.612 trillion
- Exclusive perspective: When analyzing annual trade balance, first determine if improvements come from the top (exports = competitiveness) or bottom (import price drops = luck); Heisei 7 indicates temporary improvement with resource-driven gains likely to revert
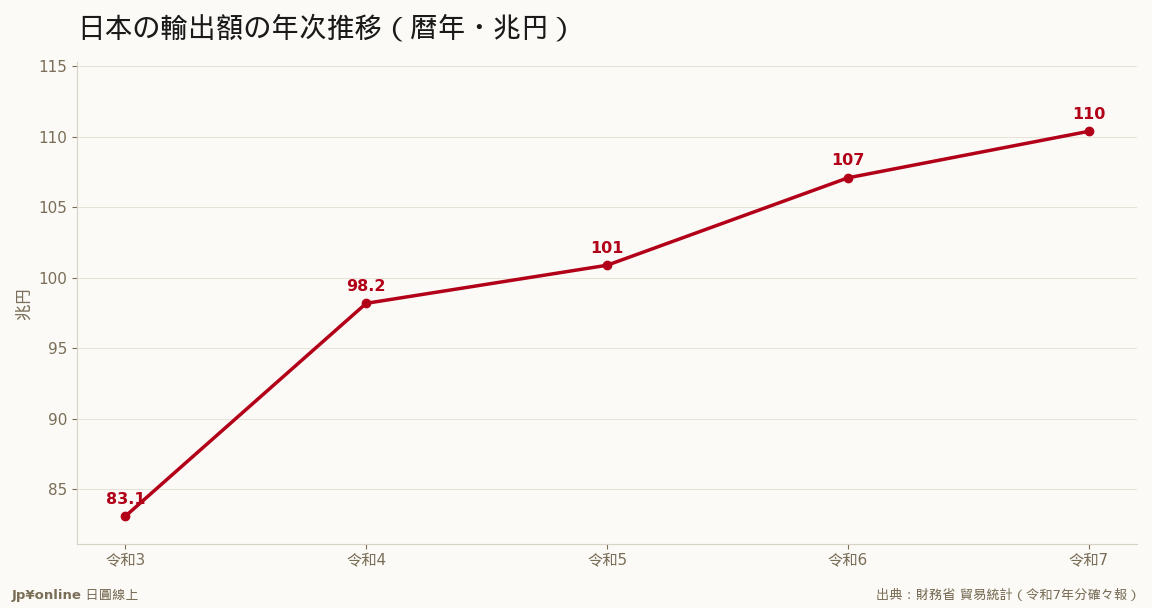
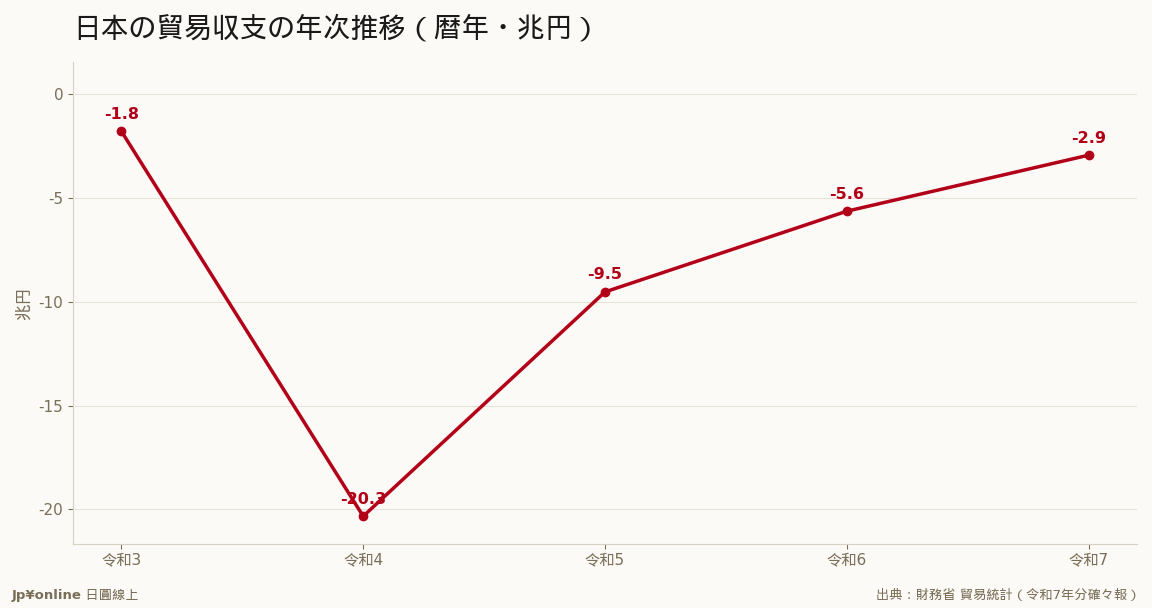
- Year-on-year trend: Exports increased from Heisei 3 ¥83.1 trillion → Heisei 4 ¥98.2 trillion → Heisei 5 ¥100.9 trillion → Heisei 6 ¥107.1 trillion → Heisei 7 ¥110.4 trillion; Trade deficit narrowed from Heisei 4 historical maximum of ¥20.33 trillion to Heisei 7 ¥2.93 trillion after four consecutive years of reduction = story of energy shock entry and exit in 2022
According to the Ministry of Finance's final trade statistics for Heisei 7 (2025 calendar year): exports reached ¥110.4 trillion (+3.1%, highest in history and consecutive 5-year increase); imports stood at ¥113.3301 trillion (+0.5%); and the trade deficit was ¥2.9296 trillion, continuing a fifth consecutive year of deficit but narrowing by 47.9% from ¥5.6325 trillion the previous year (virtually halved). In summary: Japan's exports indeed hit historical highs, but the improvement in the trade balance is largely due to cheaper energy bills for imports—fuel imports totaling ¥22.1450 trillion fell 13.2% (-3.0 percentage points contribution), mainly from crude oil -11.5%, liquefied natural gas -8.5%, and coal -26.2%. The export momentum has shifted from vehicles to the semiconductor chain: semiconductors and related electronic components rose 8.4% to ¥6.588 trillion, while auto exports fell 1.7% to ¥17.612 trillion.
[Conclusion First] The Ministry of Finance's final trade statistics for Heisei 7 (2025 calendar year): exports reached a record ¥110.4 trillion (+3.1%), the highest in history and consecutive five-year increases; imports were ¥113.3301 trillion (+0.5%); the trade deficit was ¥2.9296 trillion, still negative but significantly narrowed from ¥5.6325 trillion the previous year (47.9% decrease). In summary: Japan's exports indeed hit historical highs, but the improvement in the trade balance is largely due to cheaper energy bills for imports.
[Plain Talk Analysis] Trade balance = exports - imports. A deficit means importing more than exporting; it takes out more foreign currency and brings in less money, a structural headwind for the yen. Japan's consecutive five-year deficits since Heisei 3 (2021) are largely due to increased import costs driven by soaring energy prices from 2022 and yen weakness. Therefore, when looking at Japanese trade balances, it is important not just to focus on whether there is a surplus or deficit, but also the reason for any reduction in the deficit—whether export competitiveness has improved or import costs have dropped due to price falls.
[Decoding the Numbers: Revenue from Exports, Improvement via Imports] Let's start with exports. The record high of ¥110.4 trillion was driven by semiconductors and other electronics: semiconductors and related electronic components were exported at ¥6.588 trillion (+8.4%); machinery for such semiconductors was at ¥4.5471 trillion, driving the overall total. However, Japan's traditional automotive exports fell 1.7% to ¥17.612 trillion. This shows a shift in export momentum from 'cars' to 'semiconductor chain'. Regarding imports, this is the true driver of deficit reduction: mineral fuel (crude oil, natural gas, coal) imports totaled ¥22.1450 trillion (-13.2%), accounting for 3.0 percentage points of the decrease—crude oil and heavy oil fell 11.5%, liquefied natural gas by 8.5%, and coal by 26.2%. Cheaper energy bills, coupled with a 11.1% reduction in Middle Eastern imports, kept overall imports at +0.5% growth, narrowing the deficit from ¥5.6325 trillion to ¥2.9296 trillion.
[Unpacking Trade Balance: Which Source of Improvement—Top or Bottom] The improvement in trade balance can come from two sources: an actual increase in exports (top) meaning stronger competitiveness; a reduction in imports due to falling resource prices (bottom), which is good luck. In Heisei 7, the deficit reduction mainly came from the bottom—energy price falls contributed significantly, while export growth partly reflected yen weakness for the year (+3.1%). Separating these two sources of improvement matters because: improvements driven by resources are not sustainable—they could reverse if energy prices rise or the yen weakens again.
[Opportunities and Risks] For semiconductor equipment and electronic components suppliers in Japan, including many Taiwanese companies, the export momentum moving to the semiconductor chain is a structural windfall. For Japanese car manufacturers, reduced auto exports due to US tariffs are an adverse headwind. For those holding yen assets, reduced deficits provide some support for the yen but are not strong enough to be interpreted as fundamental yen strength.
[Opposition View] It would be too pessimistic to dismiss this report entirely. Five consecutive years of export growth and a new historical high in exports reflect expanding absolute foreign demand. The semiconductor chain's growth is real, not just accounting for currency effects. And four straight years of deficit reduction are positive. Yes, lower resource prices provide good luck, but Japan is also diversifying its export basket towards higher-value-added semiconductor products, a mix of structural and lucky factors.
[What Does 'Kakkūpo' Mean in Plain Talk] A kakkūpo report is the final version of Japanese trade statistics—after preliminary reports and final versions, it is the most accurate. Thus, for Heisei 7, the numbers ¥110.4 trillion and a deficit of ¥2.93 trillion are the final values after multiple revisions, making them more suitable than monthly fluctuating preliminary figures for annual review and long-term judgment.
[Key Exports: Structural Shift] Keep in mind major export categories to understand Japan's industry better: automobiles at ¥17.612 trillion (about 16%, but down 1.7%); semiconductors and other electronic components at ¥6.588 trillion (+8.4%); machinery for such semiconductors at ¥4.5471 trillion. The traditional top export, automobiles, is steady or shrinking, while semiconductor-related products together exceed ¥11 trillion and are growing—evidence of the shift in export momentum to the semiconductor chain.
[Historical Context] Over five years: exports from Heisei 3 (2021) at ¥83.1 trillion → Heisei 4 (2022) at ¥98.2 trillion → Heisei 5 (2023) at ¥100.9 trillion → Heisei 6 (2024) at ¥107.1 trillion → Heisei 7 (2025) at ¥110.4 trillion, consistently rising; trade balance from Heisei 3 (2021) deficit of ¥1.78 trillion → Heisei 4 (2022) historical maximum deficit of ¥20.33 trillion due to energy shocks → Heisei 5 (2023) at ¥9.52 trillion → Heisei 6 (2024) at ¥5.63 trillion → Heisei 7 (2025) at ¥2.93 trillion, narrowing after a huge increase in the previous year. This curve essentially tells the story of how energy shocks entered and exited the scene from 2022, with trade balance performance heavily influenced by energy prices and yen movements over the past four years.
[Practical Tips for Taiwanese Readers] First, distinguish whether deficit reduction comes from better exports (competitiveness) or cheaper imports due to resource price falls (good luck); Heisei 7 indicates a temporary improvement. Second, export momentum moving from cars to semiconductors is a long-term indicator of Japanese supply chain performance, including many Taiwanese companies. Third, remember that energy prices and the yen are key switches for Japan's trade balance—those tracking inflation or the yen should focus on 'mineral fuels -13.2%' rather than new export highs.
[Next Steps to Watch] One, monitor oil prices and the yen in 2026 calendar year for any increases that could widen deficits; two, see if semiconductor chain exports can continue to support growth momentum post-cars; three, assess whether increased US tariffs on autos will significantly impact 2026 calendar year trade reports.