Japan's Private Domestic Demand, April-June 2026: Consumption Falls for the First Time in Seven Quarters, Housing Still 7.1% Below Pre-PandemicA · FULL TRANSLATION
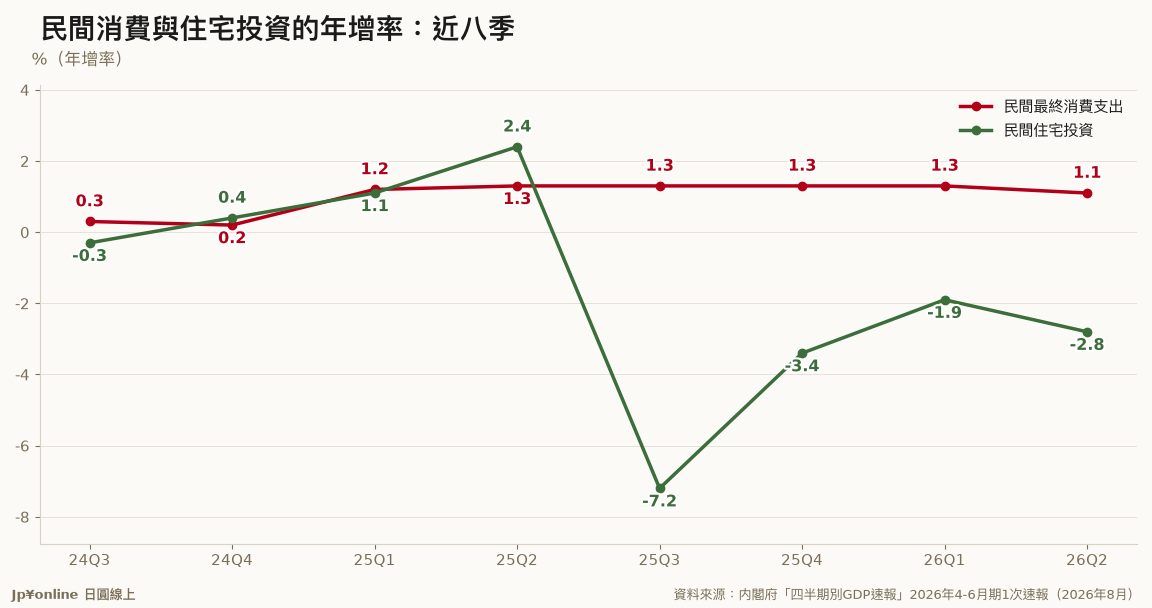
- Private final consumption was JPY 310.7 trillion at a seasonally adjusted annual rate, down 0.0% on the quarter and an annualised 0.1%, JPY 57.4 billion below the previous quarter. It is the first decline after seven consecutive quarterly increases since July-September 2024, with year-on-year growth of 1.1% against 1.3% in each of the previous four quarters
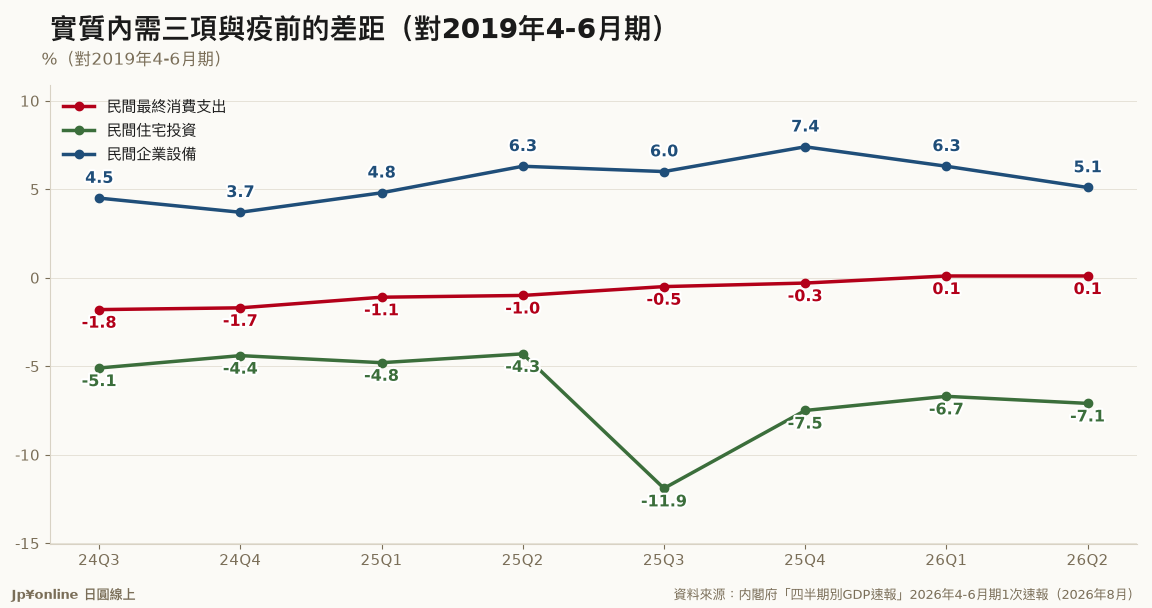
- Measured against April-June 2019, real private consumption is just 0.1% higher: essentially flat over seven years
- Residential investment was JPY 22.70 trillion, down 0.5% on the quarter and an annualised 1.8%, and down 2.8% year on year, a fourth straight annual decline after -7.2%, -3.4% and -1.9%. It sits 7.1% below the pre-pandemic quarter, the only one of the three components still well under that level
- Business capex was JPY 107.4 trillion, down 1.2% on the quarter and an annualised 4.6%, and down 1.1% year on year, the first annual fall in the eight quarters shown and JPY 1.27 trillion below the previous quarter, though still 5.1% above pre-pandemic
- For property readers the point is supply: real residential investment has fallen year on year for four quarters and remains about 7% below pre-pandemic, so new housing supply is shrinking. That belongs next to any price statistic
This is the first instalment of a fixed series tracking the private side of Japan's GDP flash estimate: household consumption, residential investment and business capex, with the same charts and indicators each quarter.
In April-June 2026, real private final consumption was JPY 310.7 trillion at a seasonally adjusted annual rate, down 0.0% on the quarter and an annualised 0.1%, JPY 57.4 billion below the previous quarter. That ends seven consecutive quarterly increases running from July-September 2024. Year-on-year growth held at 1.1%, down from a steady 1.3%. The more telling comparison is with 2019: measured against April-June that year, real consumption is only 0.1% higher. Seven years, essentially flat in volume terms.
Housing is weaker. Residential investment was JPY 22.70 trillion, down 0.5% on the quarter and 2.8% year on year, a fourth consecutive annual decline. It remains 7.1% below the pre-pandemic quarter, the only component still clearly under that mark, and no quarter has returned to positive growth since the 7.2% drop in July-September 2025.
Capex weakened most this quarter: JPY 107.4 trillion, down 1.2% on the quarter, an annualised 4.6%, and 1.1% year on year, the first annual fall in eight quarters. It is nonetheless 5.1% above pre-pandemic.
For property readers the signal is on the supply side. Real residential investment has been shrinking for four straight quarters, so new supply is contracting, which is the other half of any story told with price indices alone.
List of Statistical Tables (April-June 2026, First Preliminary Estimates) — the private demand sections
Data period: January-March 1994 to April-June 2026, first preliminary estimates. Released 17 August 2026.
I. Gross Domestic Product (Expenditure Approach) and Demand Components Notes on use: because of revisions to source materials, figures in the nominal unadjusted series from January-March 2021 onward, and in the real unadjusted series from January-March 2020 onward, may have been revised. Seasonal adjustment is re-applied through the latest observation each time, so nominal and real seasonally adjusted series are revised back to January-March 1994. Always work from the most recent release.
The tables in this section cover private final consumption expenditure, household final consumption expenditure (with a variant excluding imputed rent), private residential investment, private non-residential investment, changes in private inventories, government consumption, public investment, changes in public inventories, and exports and imports of goods and services. They are grouped into levels, growth rates, contributions and deflators, each available quarterly and by fiscal and calendar year, in nominal and real terms, unadjusted and seasonally adjusted, with annualised versions of the seasonally adjusted quarter-on-quarter changes and contributions.
Notes on the data files: all files are CSV text files. Open the file you need, save it as "name.csv" and read it into spreadsheet software as a comma-separated text file. Where a quarter-on-quarter figure is "-0.0", some software will display it as "0". A separate PDF explains how contributions are calculated.
II. Domestic Household Final Consumption Expenditure by Type, and Exports and Imports by Goods and Services Household final consumption expenditure by type assigns each item of the 116-purpose classification to one of four types: durable goods, semi-durable goods, non-durable goods and services. This is the main source for separating spending on durables such as appliances, furniture and cars from spending on services.
III. Compensation of Employees Seasonal adjustment is re-applied each release and revises the series back to January-March 1994. Levels in the seasonally adjusted series are shown at annual rates. Real values are reference figures obtained by dividing nominal compensation of employees by the deflator for household final consumption expenditure excluding imputed rent and FISIM, and by the deflator for household final consumption expenditure.
Reference tables are also published for changes in private inventories by type and for demand-side, supply-side and common estimation items covering domestic household final consumption expenditure and private non-residential investment.
Publisher: Economic and Social Research Institute, Cabinet Office, 1-6-1 Nagatacho, Chiyoda-ku, Tokyo 100-8914.