Japan GDP, April-June 2026: Annualised +1.1%, With Consumption, Housing and Capex Subtracting a Combined 1.0 PointA · FULL TRANSLATION
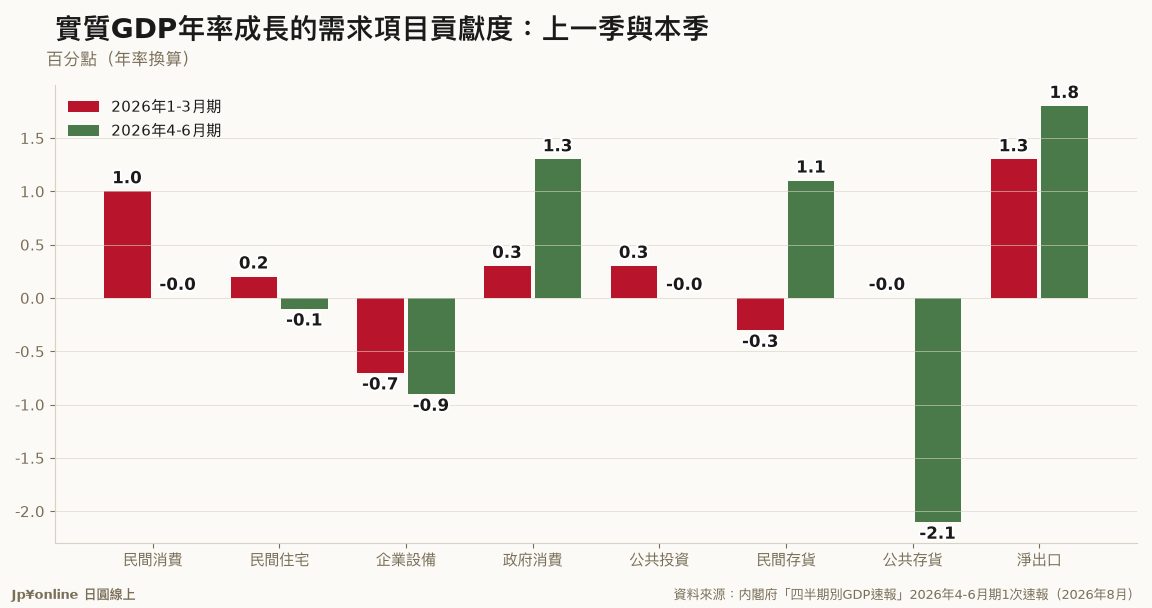
- Real GDP rose 0.3% on the quarter, an annualised 1.1%, after 0.5% and an annualised 1.9% in January-March: a second straight quarter of growth but 0.8 points slower. The seasonally adjusted annualised level is JPY 598.3 trillion, 2.5% above the same quarter of 2019, with the unadjusted series up 0.7% year on year
- Annualised contributions: private consumption -0.0, residential investment -0.1 and business capex -0.9, a combined drag of 1.0 point. Growth came instead from government consumption +1.3, private inventories +1.1 and net exports +1.8
- The +1.8 points from net exports came mainly from shrinking imports: exports rose an annualised 2.1% while imports fell 6.0%, which arithmetically adds to GDP without external demand strengthening
- Public inventories alone subtracted 2.1 points, with the level dropping from -JPY 99.2 billion to -JPY 2,335.7 billion at a seasonally adjusted annual rate. Inventory estimates rest on the thinnest source data in the first preliminary release and are the most likely item to be revised in early September
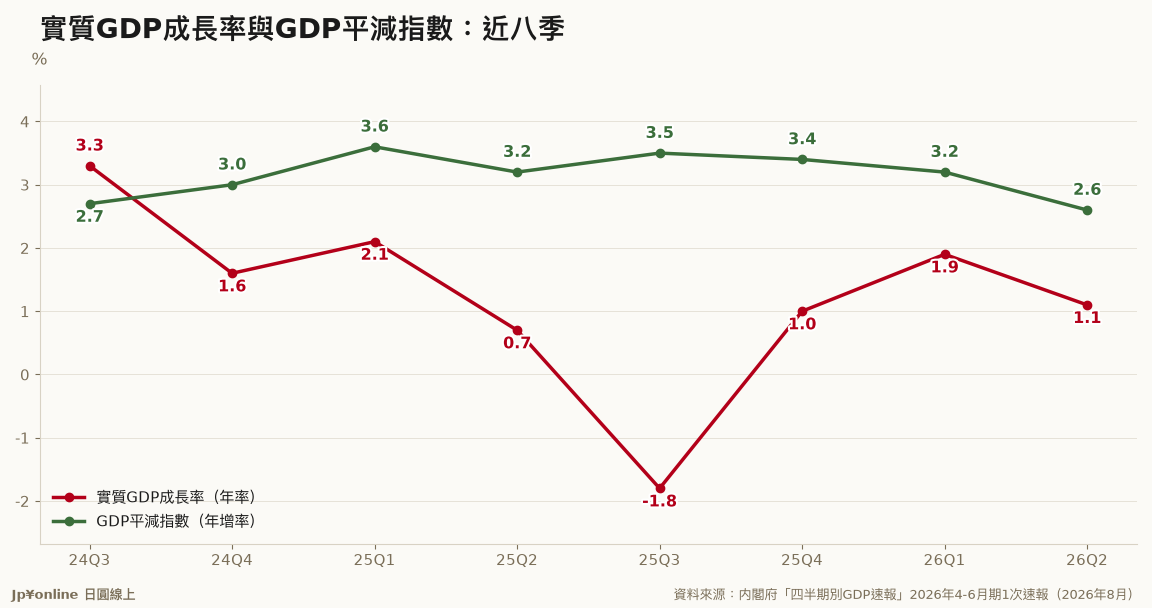
- The GDP deflator rose 2.6% year on year, down from 3.2% and the lowest of the eight quarters shown since July-September 2024. Nominal GDP reached JPY 687.7 trillion, yet real gross national income fell an annualised 1.8%, moving opposite to GDP
This is the first instalment of a fixed series: each quarter we run the same chart and the same indicators for Japan's GDP flash estimate, adding one new point.
The Cabinet Office released the first preliminary estimate for April-June 2026 on 17 August. Real GDP rose 0.3% on the quarter, an annualised 1.1%, after 0.5% and an annualised 1.9% in the previous quarter. That is a second consecutive quarter of growth, 0.8 points slower. The level is JPY 598.3 trillion, up JPY 1.7 trillion on the quarter and 2.5% above the same quarter of 2019.
The composition matters more than the headline. Private consumption contributed -0.0 points, residential investment -0.1 and business capex -0.9, a combined drag of 1.0 point. Growth came from government consumption at +1.3, private inventories at +1.1 and net exports at +1.8. Read that last one carefully: exports rose an annualised 2.1% while imports fell 6.0%, so the positive contribution reflects shrinking imports rather than stronger external demand.
The oddest line is public inventories at -2.1 points, with the level falling to -JPY 2,335.7 billion. Inventories rest on the thinnest source data in a first estimate and are the likeliest item to move in the second estimate in early September.
On prices, the GDP deflator slowed to 2.6% year on year. Nominal GDP hit JPY 687.7 trillion, but real gross national income fell an annualised 1.8% as terms of trade worsened and net income from abroad dropped from JPY 35.8 trillion to JPY 32.9 trillion.
List of Statistical Tables (April-June 2026, First Preliminary Estimates)
Data period: January-March 1994 to April-June 2026, first preliminary estimates. Released 17 August 2026.
I. Gross Domestic Product (Expenditure Approach) and Demand Components Notes on use: because of revisions to source materials, figures in the nominal unadjusted series from January-March 2021 onward, and in the real unadjusted series from January-March 2020 onward, may have been revised. Seasonal adjustment is re-applied through the latest observation each time, so both nominal and real seasonally adjusted series are revised retroactively all the way back to January-March 1994. Users should therefore always work from the most recent release.
Notes on the data files: all files are text files in CSV format. Open the file containing the data you need, save it as "name.csv", then read it into spreadsheet software as a comma-separated text file. Note that where a quarter-on-quarter figure is "-0.0", some software will display it as "0". A separate PDF explains how contributions are calculated.
The tables are grouped into levels, growth rates, contributions and deflators, each split between quarterly and fiscal-year/calendar-year frequencies. Levels cover nominal and real series, unadjusted and seasonally adjusted, by fiscal year and calendar year. Growth rates cover year-on-year changes for unadjusted series and quarter-on-quarter changes for seasonally adjusted series, plus annualised versions of the nominal and real seasonally adjusted series. Contributions follow the same structure and include an annualised real seasonally adjusted table. Deflators cover quarterly unadjusted and seasonally adjusted series with their rates of change, plus fiscal-year and calendar-year deflators.
II. Domestic Household Final Consumption Expenditure by Type, and Exports and Imports by Goods and Services Household final consumption expenditure by type assigns each item of the 116-purpose classification to one of four types: durable goods, semi-durable goods, non-durable goods and services. A PDF explains the classification.
III. Compensation of Employees Seasonal adjustment is re-applied each release and revises the series back to January-March 1994, so the latest release should be used. Levels in the seasonally adjusted series are shown at annual rates. Real values are reference figures obtained by dividing nominal compensation of employees by the deflator for household final consumption expenditure excluding imputed rent and FISIM, and by the deflator for household final consumption expenditure.
Reference tables are also published for changes in private inventories by type and for demand-side, supply-side and common estimation items (domestic household final consumption expenditure and private non-residential investment).
Publisher: Economic and Social Research Institute, Cabinet Office, 1-6-1 Nagatacho, Chiyoda-ku, Tokyo 100-8914.