Tokyo Central Five Districts Office Market: Landlord-Favorable Conditions Persist Despite ChallengesA · FULL TRANSLATION
- Tokyo Central Five Districts: Vacancy rate of 2.07% (down two consecutive months, far below the equilibrium line at 5%)
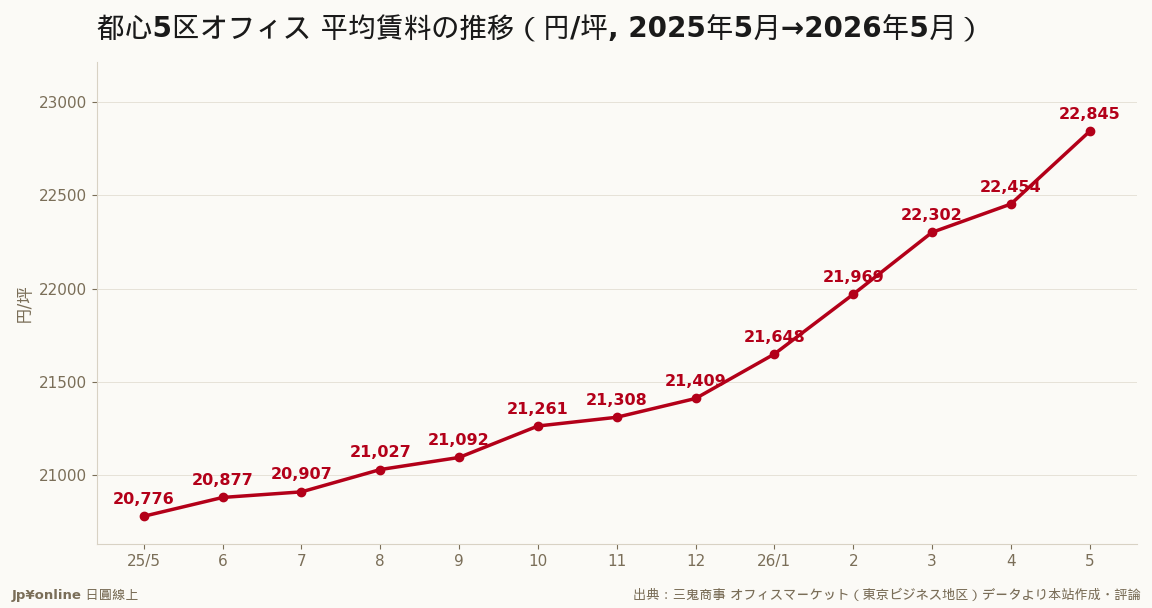
- Rental rate of 22,845 yen per square meter, up by 9.96% year-over-year for 26th consecutive month
- New vs existing buildings: New buildings with vacancy rates of 11.78% vs existing ones at 1.89%
- Location differentials: Lowest vacancy rate in Chiyoda (1.23%) and Shibuya (1.28%), highest in Chuo (2.92%)
- Highest rental prices in Shibuya (25,507 yen per square meter) and second-highest in Chiyoda (24,305 yen), lowest in Shinjuku (19,978 yen)
- Concerns: Potential for vacancy rates to rise if large-scale new buildings complete by 2026-27, rent pressures nearing tenant critical points, and office market as a lagging indicator of economic conditions
- Practical implications for Taiwanese companies: Minimal negotiation space now (move to Shinjuku), focus on existing fully leased properties, treat 5% vacancy rate as turning point alert line
In May 2026, the average vacancy rate in Tokyo's central five districts (Chiyoda, Chuo, Minato, Shinjuku, and Shibuya) fell to 2.07%, marking two consecutive months of decline. The average rental rate reached 22,845 yen per square meter, up by 9.96% year-over-year for the 26th consecutive month. With scarce vacancies and soaring rents, Tokyo's office market is a seller's market that is harsh on tenants but sweet for landlords. New buildings with vacancy rates of 11.78%, versus existing buildings at 1.89%, indicate demand for immediately usable mature properties. The lowest vacancy rate was in Chiyoda at 1.23% and Shibuya at 1.28%. Rental prices were highest in Shibuya at 25,507 yen per square meter and second-highest in Chiyoda at 24,305 yen, with the lowest being in Shinjuku at 19,978 yen.
【Concluding Thoughts】In May 2026, the office market in Tokyo's central five districts (Chiyoda, Chuo, Minato, Shinjuku, and Shibuya) has delivered a landlord-friendly report card: with an average vacancy rate of 2.07% for two consecutive months, down from 2.15%, and the average rental rate at 22,845 yen per square meter (up by 9.96% year-over-year), this is the 26th month in a row of rent increases. The scarcity of vacancies and skyrocketing rents indicate that Tokyo's top-tier office market is currently a seller's market harsh on tenants but sweet for landlords. For Taiwanese readers considering setting up or investing in office properties in Japan, especially in Tokyo, these figures serve as the first-hand gauge to judge entry costs and negotiation space. (Data source: Sankei Shoji market data, reported by this site)
【White-boarding the Metrics】The vacancy rate is calculated as the ratio of vacant area to available rental area; 5% is recognized as the equilibrium line in the industry—below 5%, landlords dominate, and tenants have limited negotiating power. Above 5%, tenants hold more favorable conditions. With a central five districts vacancy rate at 2.07%, it indicates an extremely tight supply-demand situation that continues to tighten. Rents have risen by approximately 2,000 yen per square meter year-over-year, a nearly 10% increase, indicating this trend is not just a short-term fluctuation but a sustained upward movement.
【Breaking Down the Numbers: New vs Existing and Locations】Examining the structure reveals two divides. One is between new buildings (11.78%) and existing ones (1.89%), reflecting demand for immediately usable mature properties. The other is by location: the lowest vacancy rates were in Chiyoda at 1.23% and Shibuya at 1.28%; highest was Chuo at 2.92%. Highest rental prices were in Shibuya at 25,507 yen per square meter and second-highest in Chiyoda at 24,305 yen; lowest was Shinjuku at 19,978 yen. In the office property pyramid, Chiyoda and Chuo with their mature properties are at the top, with high demand driving prices up. Shinjuku, due to relatively ample supply, has lower per unit costs.
【Opposing Viewpoints】While the landlord-friendly conditions persist, there are concerns: first, a 11.78% vacancy rate in new buildings suggests ongoing supply replenishment; if large-scale new buildings complete by 2026-27, this exceptionally low vacancy could revert to normal levels. Second, while rent increases have pressured tenants, approaching critical points will likely see a return to remote and lean office work practices that could suppress demand. Third, office properties lag behind economic indicators: weaker economic conditions or corporate profitability could quickly cool rental demand and growth, with rent increases often following this trend after reversals.
【Practical Meaning for Taiwanese Readers】Firstly, companies setting up in Tokyo now face minimal negotiation space—vacancy rates at 2% and continuous rent hikes mean budgeting for annual rent increases. Consider relocating to areas like Shinjuku with lower per unit costs. Secondly, when investing in office properties (including J-REITs), low vacancy rates plus rising rents support rental income growth; however, avoid cases facing heavy new supply pressure. Focus on existing fully leased mature properties. Thirdly, treat 5% vacancy rate as a turning point alert line—currently at 2.07%, if it rises above this level, the seller's market logic will reverse.
【What to Watch Next】Firstly, monitor the impact of large-scale new building completions in 2026 H2 on vacancy rates. Secondly, whether rent increases can be sustained—any interruption would signal a top-of-the-market indicator. Lastly, track Japanese corporate profitability and capital investment trends to gauge ongoing office demand.