Tokyo Holds at 78.7% While Japan's High-Occupancy Map Shrinks: April 2026 Prefecture RankingsA · FULL TRANSLATION
# occupancy rate# Japan lodging statistics# Tokyo hotels# prefecture ranking# hotel investment
Key Points
- National occupancy 59.1% in April (-2.3pt YoY), 60.6% in May prelim; prefectures above 80%: business hotels 8→6, city hotels 7→2
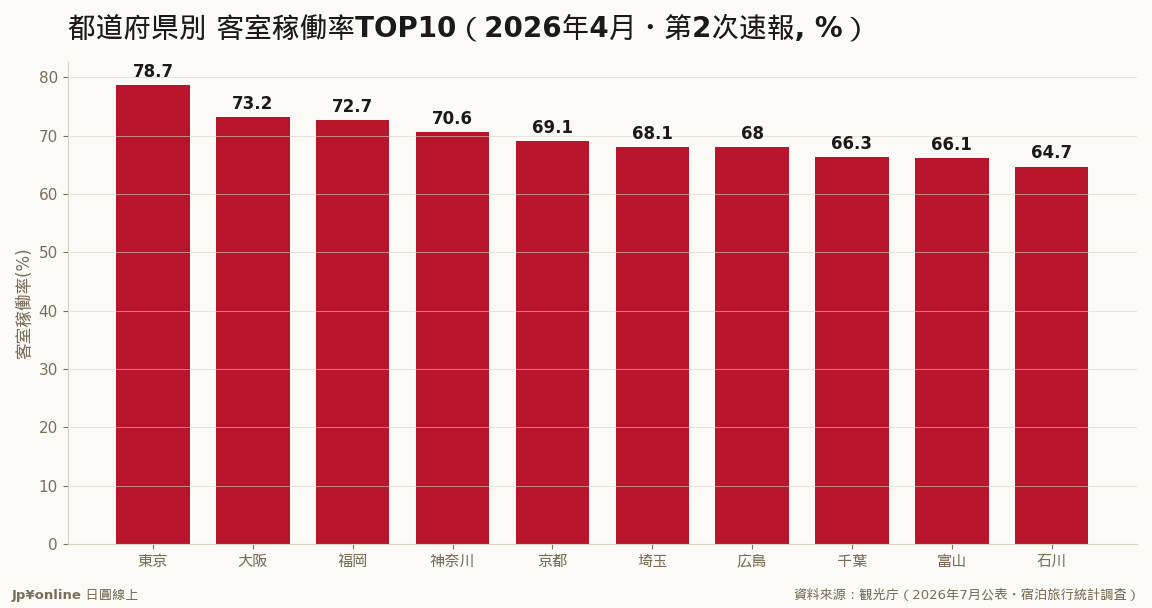
- Prefecture top 10: Tokyo 78.7% (only -0.7pt), Osaka 73.2%, Fukuoka 72.7%, Kanagawa 70.6%, Kyoto 69.1%; Osaka -7.8pt and Aichi -8.7pt hit hardest by the China slump
- Tokyo by type: city hotels 85.8% (No.1 nationwide), simple lodgings 54.8% (No.1; national average just 24.6%), business hotels 78.1%
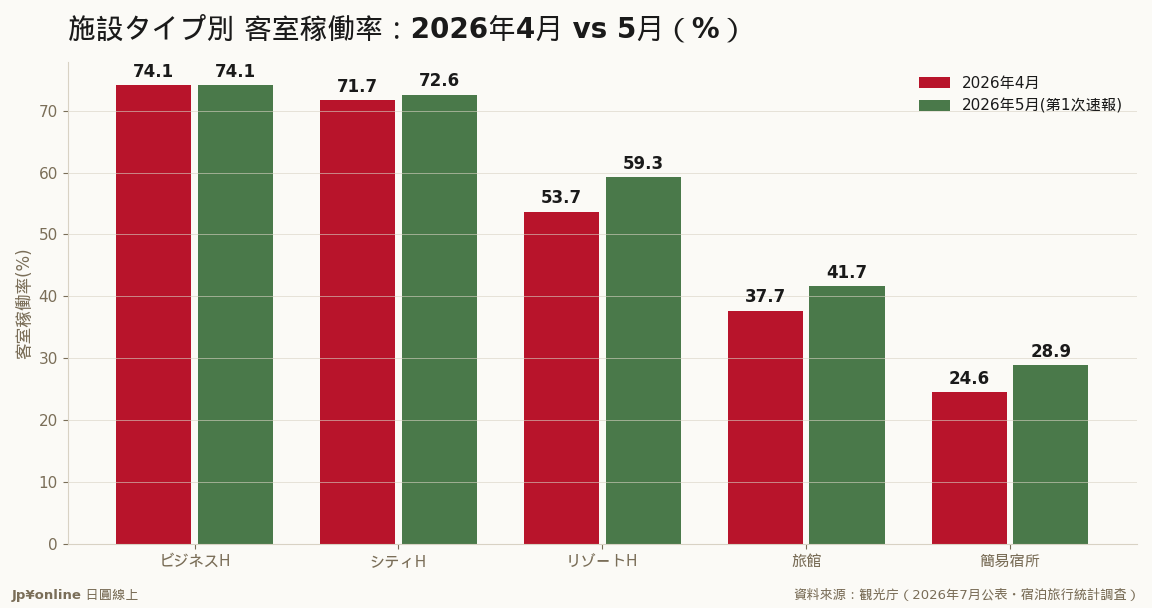
- Scissors pattern: ryokan +2.4pt and resorts +0.5pt improved YoY while city hotels fell -4.4pt — group-tour losses vs domestic and East Asian FIT recovery
- May figures are first-preliminary and the survey's stratification changed in Jan 2026, so read trends rather than single months
Analysis
JTA's second preliminary for April 2026 completes the occupancy map: the national average slid to 59.1% (-2.3pt YoY), and the number of prefectures above 80% shrank sharply — business hotels from 8 to 6, city hotels from 7 to just 2. Tokyo stands apart at 78.7%, down only 0.7pt, with its city hotels at 85.8% ranking first nationwide. Meanwhile ryokan (+2.4pt) and resort hotels (+0.5pt) turned positive against the trend, a scissors pattern that widened further in May.