Japan Inbound by Market Q2 2026: Taiwan Jumps 27.9% to Second, but Ranks 21st of 23 on Per-Visitor SpendA · FULL TRANSLATION
- Top five by spending: United States JPY 384.8 billion (15.3%), Taiwan JPY 363.9 billion (14.5%), China JPY 259.2 billion (10.3%), South Korea JPY 258.9 billion (10.3%), Hong Kong JPY 145.2 billion (5.8%).
- Taiwan's spending rose 27.9%, on 1.841 million visitors (up 17.4%) each spending JPY 196,641 (up 9.2%).
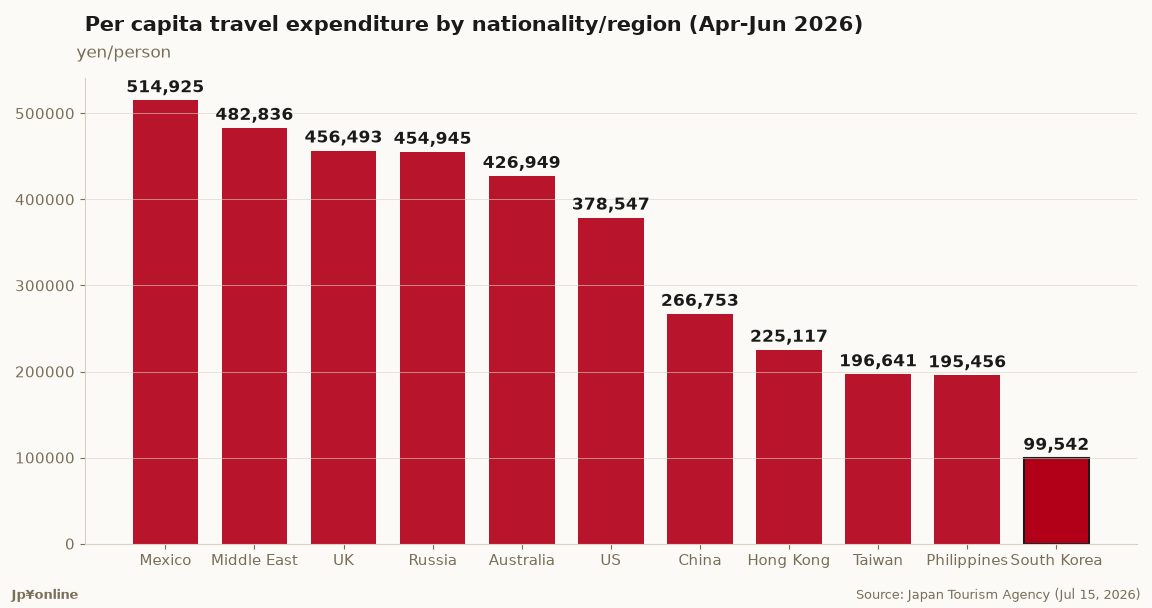
- Taiwan's per-visitor spend ranks 21st of 23 named markets, above only the Philippines at JPY 195,456 and South Korea at JPY 99,542.
- The top three per-visitor markets are Mexico at JPY 514,925, the Middle East at JPY 482,836 and the UK at JPY 456,493.
- China's spending fell 48.8% to JPY 259.2 billion on a 52.5% drop in arrivals, while its per-visitor spend rose 9.4% to JPY 266,753 and average stay lengthened 3.3 nights to 11.2.
Two changes stand out in this quarter's ranking. The United States takes first place at JPY 384.8 billion, a 15.3% share, with Taiwan second at JPY 363.9 billion, 14.5%, up 27.9% year on year. In the same quarter of 2025 China led with JPY 506.4 billion and a 20.2% share; this quarter it fell to JPY 259.2 billion and 10.3%, down 48.8%.
Taiwan grew on both volume and price. Arrivals reached 1.841 million, up 17.4%, and per-visitor spending reached JPY 196,641, up 9.2%.
Seen another way the picture is less flattering. Taiwan's JPY 196,641 ranks 21st among the 23 named markets, ahead of only the Philippines and South Korea. Mexico at JPY 514,925, the Middle East at JPY 482,836 and the UK at JPY 456,493 are all at least 2.3 times higher. Length of stay explains much of it: Taiwan averages 6.1 nights, unchanged from a year earlier, against 14.1 for the UK, 15.3 for Australia and 16.0 for France.
Taiwanese visitors also allocate differently. Their per-visitor shopping of JPY 68,093 exceeds lodging at JPY 63,868, with food at JPY 41,136. The UK order is reversed: lodging JPY 217,781, food JPY 106,005, shopping JPY 54,214. Tax-free processing backs this up, used by 81.88% of Taiwanese respondents against 63.58% overall.
Nationality and region detail from the Japan Tourism Agency release for April-June 2026 (first preliminary estimate), with supporting figures from the tabulation workbook.
Total inbound travel spending is estimated at JPY 2,509.6 billion. The United States is largest at JPY 384.8 billion (15.3% share), followed by Taiwan JPY 363.9 billion (14.5%), China JPY 259.2 billion (10.3%), South Korea JPY 258.9 billion (10.3%), Hong Kong JPY 145.2 billion (5.8%), Australia JPY 105.9 billion (4.2%), Thailand JPY 71.8 billion (2.9%), the UK JPY 68.7 billion (2.7%), Canada JPY 68.1 billion (2.7%) and Singapore JPY 60.0 billion (2.4%).
Year-on-year changes in spending: Taiwan +27.9%, South Korea +12.2%, Hong Kong +7.8%, China -48.8%, United States +8.5%, Australia +5.9%, Canada +10.4%, Singapore +20.1%, Malaysia +39.8%, Indonesia +40.3%, India +43.8%, Russia +62.3%, France +21.6%, Philippines +13.3%, Vietnam -22.1%, Italy -19.6%, Germany -1.5%, Thailand +0.3%, UK +0.4%, Spain +3.9%. Mexico, the Nordics and the Middle East were added in 2026 and have no prior-year comparison.
Per-visitor spending, all nationalities, was JPY 244,457, up 3.3%. Ranked: Mexico 514,925; Middle East 482,836; UK 456,493; Russia 454,945; Australia 426,949; France 423,237; Germany 408,361; United States 378,547; Canada 371,388; Italy 363,821; Nordics 361,941; Spain 348,690; India 303,046; Singapore 289,923; China 266,753; Indonesia 246,298; Malaysia 243,220; Thailand 230,703; Hong Kong 225,117; Vietnam 221,356; Taiwan 196,641; Philippines 195,456; South Korea 99,542.
Arrivals: South Korea 2.597 million (+14.7%), Taiwan 1.841 million (+17.4%), United States 1.016 million (+3.5%), China 971,000 (-52.5%), Hong Kong 645,000 (+4.5%).
Average nights: all nationalities 8.7 (-0.7). South Korea 3.6, Taiwan 6.1, Hong Kong 6.0, China 11.2 (+3.3), United States 10.6, UK 14.1, France 16.0, Australia 15.3.
Taiwan per-visitor by category: lodging JPY 63,868, food JPY 41,136, transport JPY 16,816, entertainment services JPY 6,614, shopping JPY 68,093.
Tax-free processing (table 5-1): 63.58% of all respondents, 81.88% for Taiwan, 64.63% for South Korea. Total tax-free purchases excluding consumption tax averaged JPY 58,717 overall and JPY 59,370 for Taiwan.