Japan Trade Balance, June 2026: Exports Up 19.3% but Imports Surge 25.4%, Swinging to a ¥406.9bn Monthly DeficitA · FULL TRANSLATION
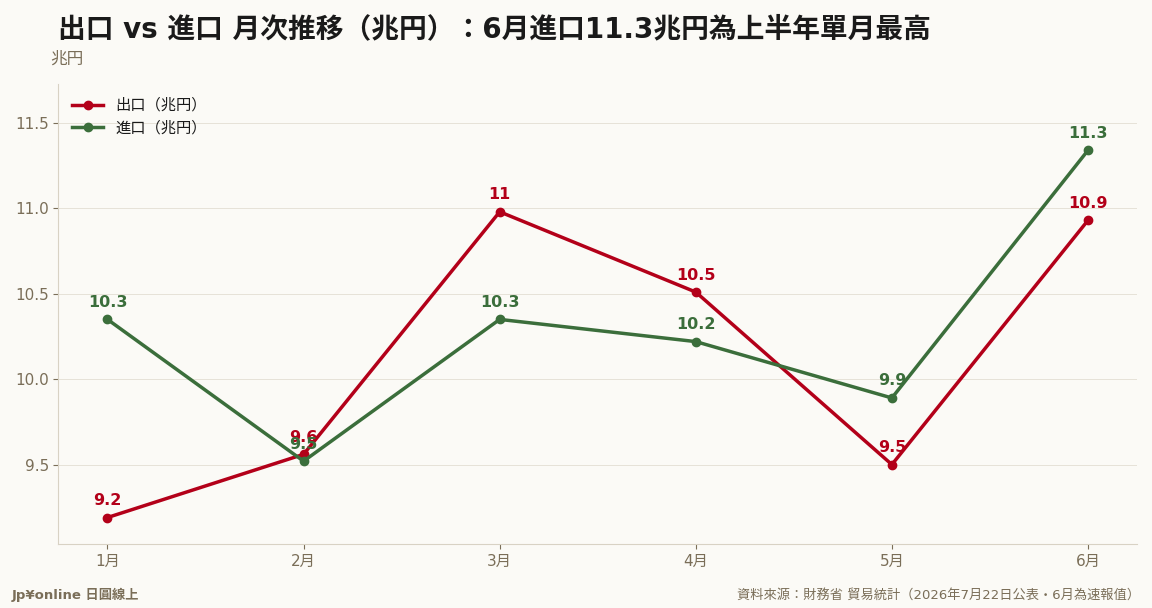
- June 2026 exports rose 19.3% y/y to ¥10.93tn while imports surged 25.4% to ¥11.34tn, leaving a ¥406.9bn deficit — a swing from the ¥122.3bn surplus in June 2025 and a second straight monthly deficit (May: ¥391.8bn deficit)
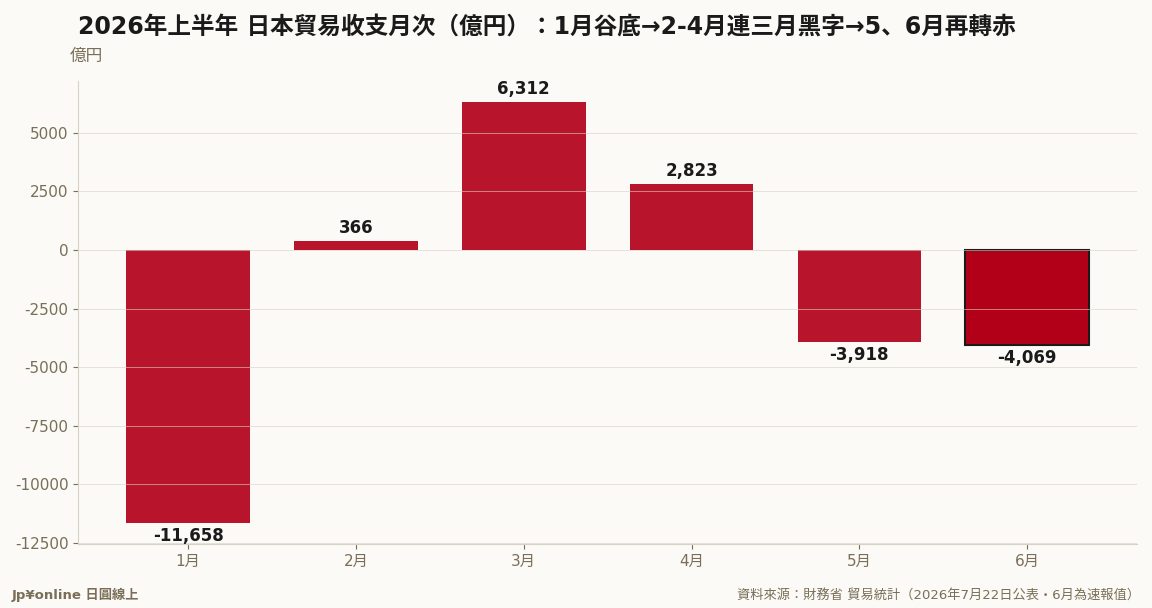
- H1 2026 cumulative: exports ¥60.66tn (+13.7%), imports ¥61.67tn (+10.7%), deficit ¥1.01tn — 57.0% smaller than a year earlier. Monthly path: deep January deficit, three surplus months (Feb–Apr), then back to red in May–June
- Import growth outpacing exports by 6.1 points drove the June deficit; per BOJ corporate goods price data we covered on July 20, 11.9 points of June's 29.7% import-price rise came purely from yen depreciation — much of the import bill is a currency price effect
- Fixed watch-point of this series: a trade deficit means real-demand yen selling by importers. USD/JPY averaged 160.69 in June (BOJ series) while the deficit ran for two straight months
This is the first instalment of our fixed monthly series tracking Japan's trade balance and its link to the yen. The June 2026 skeleton: exports of ¥10.93tn grew a solid 19.3% y/y, but imports of ¥11.34tn grew 25.4% — 6.1 points faster — producing a ¥406.9bn deficit. June 2025 had posted a ¥122.3bn surplus, so the balance swung from black to red within a year, and June marks a second consecutive deficit month after May's ¥391.8bn.
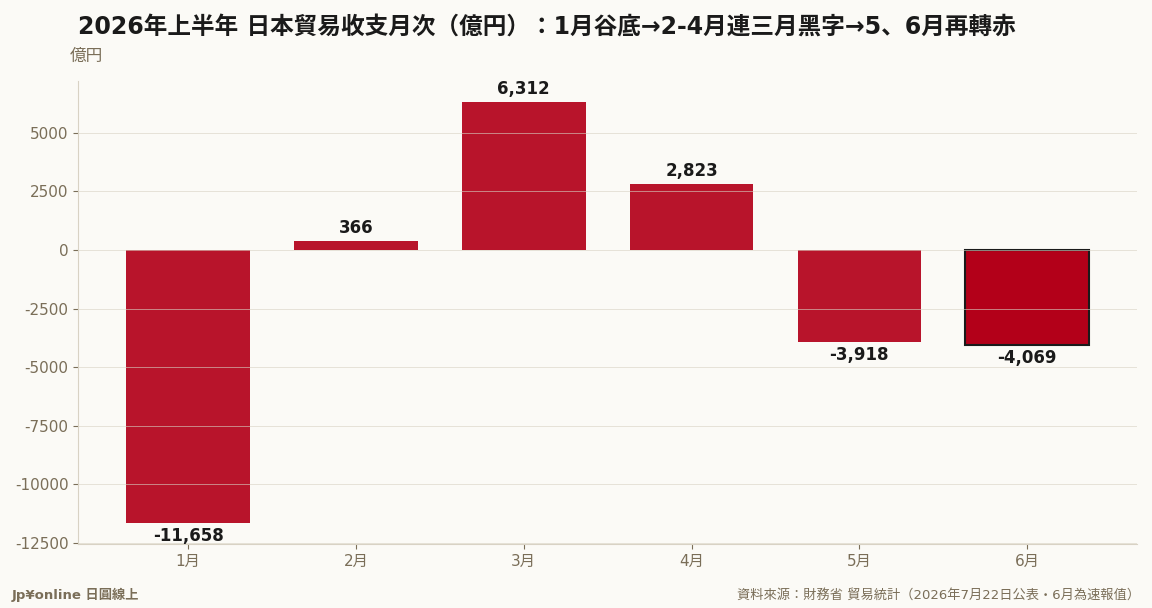
The half-year picture improved before it deteriorated: a deep ¥1.17tn deficit in January, three surplus months from February to April, then back into the red in May and June. Cumulative H1 deficit came to ¥1.01tn, 57.0% narrower than a year earlier.
The import surge needs decomposition. As we noted in our July 20 corporate goods price review, 11.9 of the 29.7 percentage points of June import-price inflation came purely from yen depreciation — much of the bigger import bill is the same goods repriced in a weaker currency. That creates a loop: weaker yen inflates imports, the balance turns negative, importers sell yen to pay, and the yen stays weak. USD/JPY averaged 160.69 in June. For readers holding yen assets or planning property remittances, the trade balance is the monthly real-demand thermometer for the currency — slow-moving but directionally honest. The release offers no 2019 comparison; we will add the pre-pandemic baseline as the series accumulates.
The Ministry of Finance released its provisional trade statistics for June 2026 and for the first half of 2026 on July 22, 2026. Summary translation (provisional figures, subject to revision):
[June 2026] Total exports: ¥10,929.0bn, up 19.3% from June 2025 (¥9,162.3bn). Total imports: ¥11,335.9bn, up 25.4% from June 2025 (¥9,040.1bn). Balance: a deficit of ¥406.9bn, versus a surplus of ¥122.3bn a year earlier; no year-on-year percentage is computed due to the sign change.
[H1 2026] Total exports: ¥60,660.6bn, up 13.7% year on year. Total imports: ¥61,675.0bn, up 10.7%. Balance: a deficit of ¥1,014.4bn, 57.0% narrower than a year earlier.
[Monthly balance, 2026] January: -¥1,165.8bn; February: +¥36.6bn; March: +¥631.2bn; April: +¥282.3bn; May: -¥391.8bn; June (provisional): -¥406.9bn.
[Quarterly] Q1 2026: exports ¥29,726.1bn (+10.5%), imports ¥30,224.1bn (+5.8%), balance -¥498.0bn. Q2 2026 (provisional): exports ¥30,934.5bn (+17.0%), imports ¥31,450.9bn (+15.9%), balance -¥516.4bn.
(Note: commodity and regional breakdowns are omitted here owing to the tabular layout of the source file; see the MOF original release. Figures marked (P) are provisional. Source: Ministry of Finance, Trade Statistics of Japan)