Tokyo-Area Investment Condo Supply Fell for a Third Year in 2025 to 4,034 Units, 43.8% of the 2007 Peak
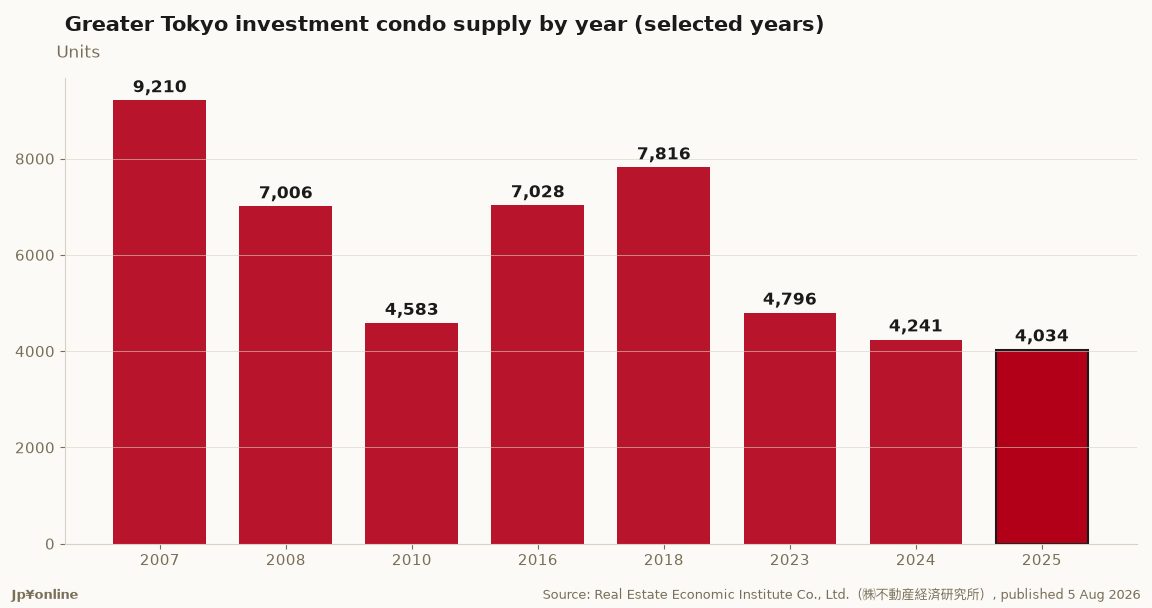
- Greater Tokyo saw 85 projects and 4,034 investment condominium units launched in 2025, against 101 projects and 4,241 units in 2024 — down 16 projects (15.8%) and 207 units (4.9%), a third straight annual decline.
- The 4,034 units are just 43.8% of the 2007 record of 9,210 (our calculation from the published figures).
- Fewer but larger projects: the average project carried 47.5 units, up 5.5 from 42.0 in 2024.
- Full-year 2025 averaged ¥36.26 million per unit (+0.8%), ¥1.366 million per square metre (+2.0%) and 26.54 sqm of exclusive area (-1.3%).
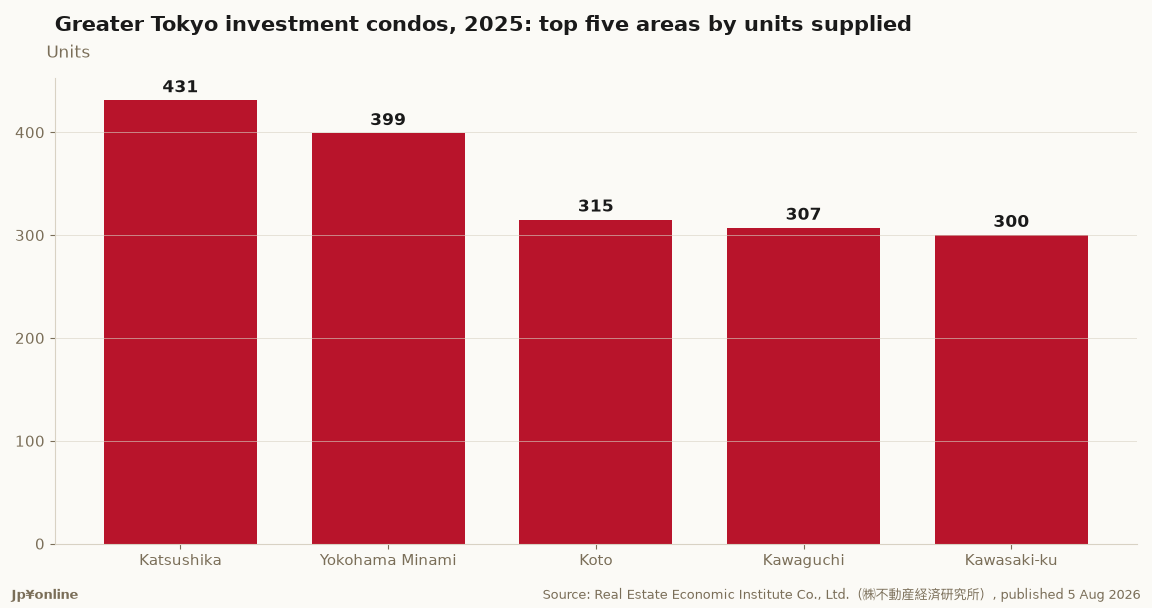
- Katsushika ward led with 431 units, followed by Yokohama Minami 399, Koto 315, Kawaguchi 307 and Kawasaki-ku 300; the top five held 43.4%, up from 39.1%. Areas with supply numbered 31, three fewer than the previous year.
- Yokohama supplied 854 units across five wards and Kawasaki 944 across six — on the annual basis, Kawasaki outstripped Yokohama.
- FJ Next returned to the top of the developer table for the first time in two years with 752 units, ahead of NST 716, INVALANCE 600, Property Agent 593 and Creas Life 268. The top five took 72.6%, up 12.6 points from 60.0%.
- Long view: supply peaked at 9,210 units in 2007, fell to 7,006 in 2008 amid rising land prices and the Lehman shock, and bottomed at 4,583 in 2010. From 2011 to 2022 it mostly ran between 5,000 and 6,000 units apart from 2016 (7,028) and 2018 (7,816), before 2023's 4,796 broke below 5,000 for the first time in 13 years.
This is the first instalment of our annual tally for Greater Tokyo investment condominiums. In 2025, 85 projects and 4,034 units were launched, against 101 projects and 4,241 units in 2024 — 16 fewer projects (15.8%) and 207 fewer units (4.9%), a third consecutive annual decline.
The long view gives the number its weight. Supply peaked at 9,210 units in 2007, fell to 7,006 in 2008 as land prices surged and the Lehman shock hit, and bottomed at 4,583 in 2010. From 2011 to 2022 it mostly held between 5,000 and 6,000 units, apart from 7,028 in 2016 and 7,816 in 2018. Then 2023's 4,796 broke below 5,000 for the first time in 13 years, followed by 4,241 in 2024 and 4,034 in 2025. That last figure is 43.8% of the 2007 peak.
Fewer projects does not mean smaller ones. The average project carried 47.5 units in 2025 against 42.0 in 2024. Project count fell 15.8% while unit count fell only 4.9%, and that gap is the whole point: the developers still building are building bigger, and small projects are disappearing. The same shift shows in concentration — the top five developers took 72.6% against 60.0% a year earlier, up 12.6 points. FJ Next returned to first place for the first time in two years with 752 units, ahead of NST 716, INVALANCE 600, Property Agent 593 and Creas Life 268.
By area, Katsushika ward led the year with 431 units, then Yokohama Minami 399, Koto 315, Kawaguchi 307 and Kawasaki-ku 300. Areas with supply numbered 31, three fewer than in 2024, and the top five share rose from 39.1% to 43.4% — more concentrated on the annual basis, the opposite of the spreading-out seen in the first half of 2026. The two should be read separately. One figure that tends to get missed: Kawasaki supplied 944 units citywide, more than Yokohama's 854.
Prices were flat in 2025: ¥36.26 million on average (+0.8%), ¥1.366 million per square metre (+2.0%), 26.54 sqm of floor area (-1.3%). Set against the ¥37.03 million and ¥1.456 million recorded in the first half of 2026, the price step-up happened in 2026, not 2025.
For scale: the 2,401 units supplied in the first half of 2026 already equal 59.5% of full-year 2025 (our calculation). That is a progress note, not a forecast — the second half decides the year. All figures from Real Estate Economic Institute Co., Ltd., published 5 August 2026.