【Tokyo-Area Resale Condos|Aug 2026】Asking Price Jumps to ¥1.1936m/sq m, 46% Above Deal Price; Listings Up 8.2% YoY
- Our last update covered June 2026 (45,995 listings; asking ¥1.1654m/sq m; 16,277 new listings; asking-to-deal gap 1.41x). This piece picks up at August; July had 47,151 listings and 16,474 new listings.
- August 2026 greater-Tokyo resale-condo inventory reached 48,235 units, up 8.2% YoY and rising for a sixth straight month, with the pace still widening.
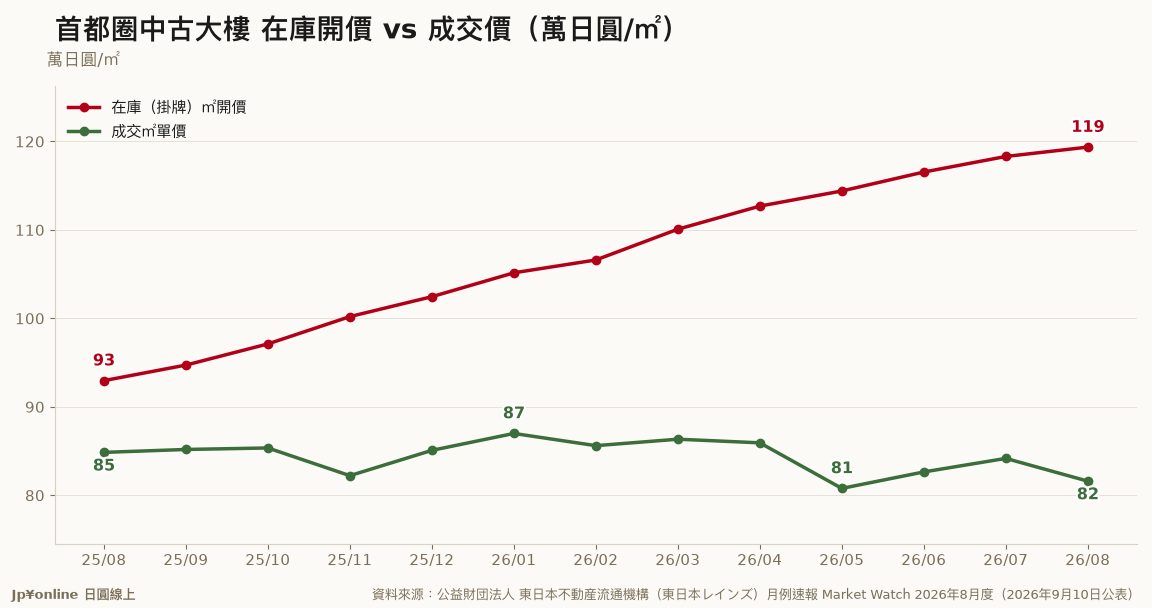
- Asking price hit ¥1.1936m/sq m, up 28.4% YoY (25th straight monthly rise); the same month's deal price was only ¥816,000, leaving asking roughly 46% (1.46x) above deals — wider than June's 41% (1.41x).
- New listings totalled 15,627, up 9.7% YoY for a third straight month — the fresh supply piling up into inventory.
- Area-level inventory YoY is not published in the summary report, so this issue's second chart tracks aggregate inventory vs new listings; the January-2025 system revision remains a comparison break.
Turn from deals to supply and the greater-Tokyo resale-condo market is being propped open by an ever-widening pair of scissors. Continuity first: our last piece (June 2026) had 45,995 listings, an asking price of ¥1.1654m/sq m and 16,277 new listings, with asking 41% above deal price; July had 47,151 listings and 16,474 new listings.
August inventory jumped to 48,235 units, up 8.2% YoY — a sixth straight monthly rise, and the report notes the pace is still widening, over two thousand more than June. The source of that build-up is fresh supply: 15,627 new listings in August, up 9.7% YoY for a third month.
The real tension is the gap between asking and deal prices. August's asking price of ¥1.1936m/sq m (+28.4% YoY, a 25th straight monthly rise) sits against an actual deal price of just ¥816,000/sq m — asking roughly 46% (1.46x) above deals, wider than June's 41%. Sellers keep marking up while deals drift down; that gap is why transactions stall, listings linger and inventory keeps stacking.
Note: the summary report does not publish area-level inventory, so this issue's second chart tracks aggregate inventory against new listings.
**Inventory: a sixth monthly rise, up 8.2% YoY and widening.** August's 48,235 listings were over two thousand above our last-covered June figure of 45,995, with the report flagging an accelerating pace.
**Asking vs deal: the gap stretches to about 1.46x.** Asking hit ¥1.1936m/sq m (+28.4% YoY, a 25th straight rise) while the same month's deal price was only ¥816,000 — asking about 46% above deals, up from June's 1.41x. That widening perception gap is the core reason deals stall and listings pile up.
**Fresh supply keeps flowing.** New listings reached 15,627 (+9.7% YoY, third straight rise) at an asking ¥1.1681m/sq m (+21.5% YoY) — new, high-priced stock steadily lifting both inventory and average asking.
**Data note and break.** The summary report omits area-level inventory YoY, so the second chart tracks aggregate inventory vs new listings; the January-2025 registration-system revision is a comparison break. See the previous issue linked below.