Tokyo's Population Hits a Record 14.3 Million: The Core 23 Wards Grow While Rural and Island Areas Keep ShrinkingA · FULL TRANSLATION
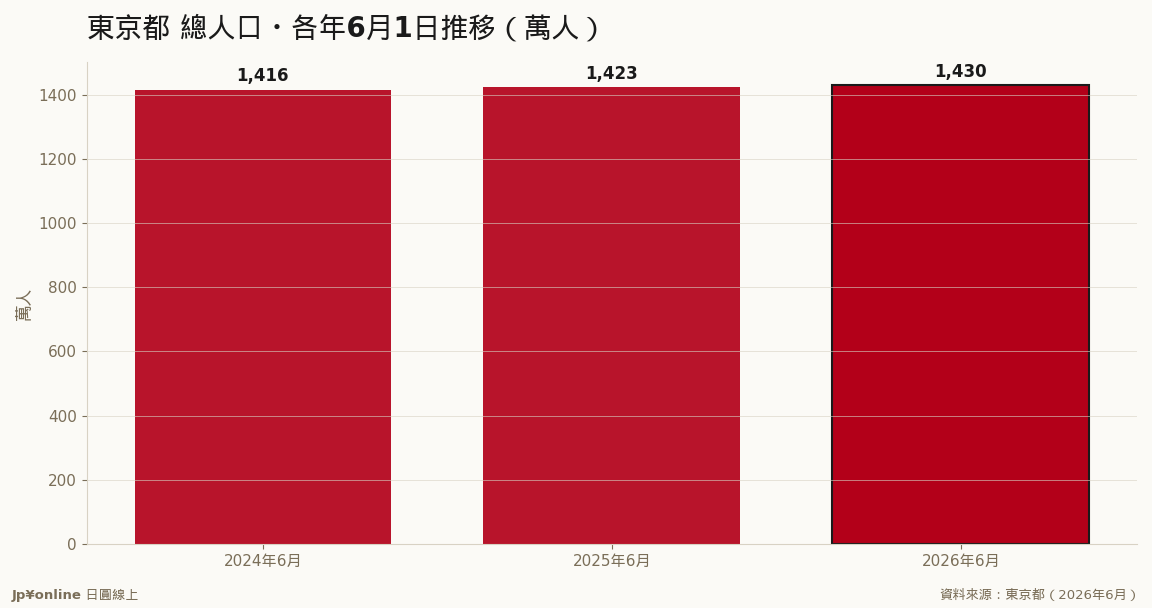
- As of June 2026, Tokyo's population reached 14,299,726, up 67,706 (+0.48%) year on year and +1.01% over two years
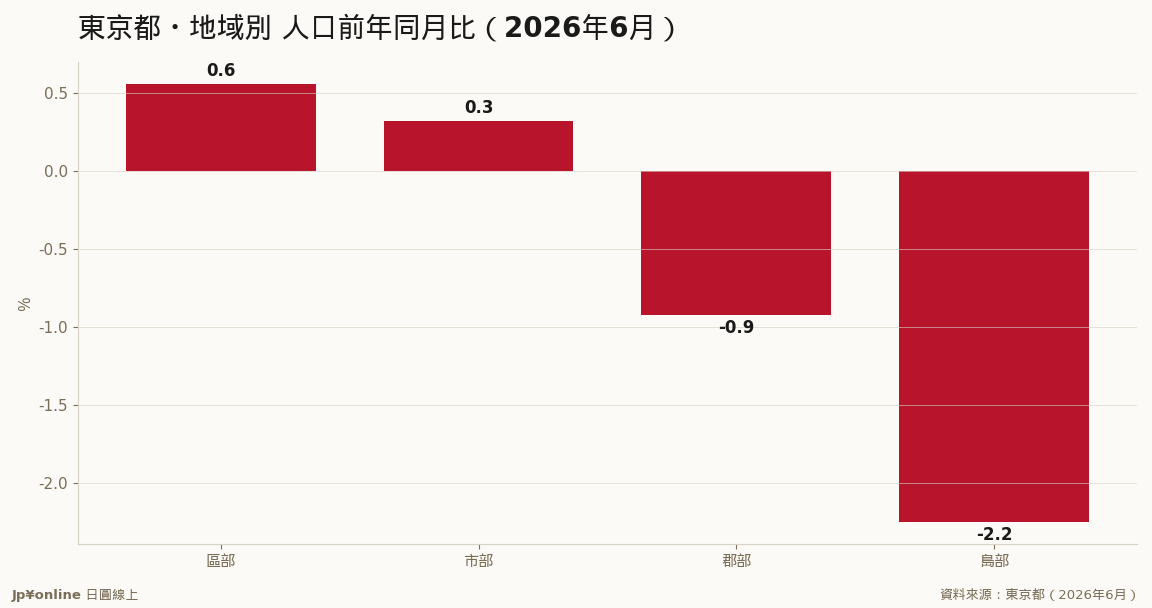
- Growth is concentrated in the central 23 wards (+0.56%); the Tama city area gained only +0.32%, while rural (-0.92%) and island (-2.25%) areas keep declining
- For property and rental investors: demand keeps concentrating in the 23 wards, widening the location gap versus suburbs and islands
- The numbers show a centripetal, core-focused growth pattern rather than broad-based gains
Tokyo's latest population estimate (as of June 1, 2026) sets another record at 14,299,726. On the surface it is steady growth: up 67,706 year on year (+0.48%) and about 140,000 over two years. But break it down by area and the picture is sharply two-tier. The central 23 wards hold 9,994,374 people, up 0.56% year on year and 1.35% over two years, driving the whole prefecture. The western Tama city area grew only 0.32%, while rural districts (-0.92%) and island areas (-2.25%) have declined for two straight years. For readers tracking Japanese property and rental yields, the message is direct: demand keeps concentrating in the core, so the central wards enjoy a solid population base while suburbs and islands face a long-term demographic headwind. Note these are estimates that fluctuate month to month, so single-month figures should not be over-read, but the two-year direction is clear: Tokyo's growth is centripetal.
First, the area-level year-on-year rates. The 23 wards lead at +0.56%, the Tama city area is a mild +0.32%, while rural and island areas are negative, with islands down 2.25%. Within one 'Tokyo,' the internal gap is obvious.
Next, the long-run total. About 14.157 million in June 2024, 14.232 million in June 2025, and 14.300 million in June 2026 — a steady climb to new highs, almost entirely powered by the central 23 wards.
The takeaway: Tokyo is still growing, but the gains are heavily concentrated in the core. For investment and living decisions, 'buying Tokyo' does not equal 'buying growth' — location is the key variable.
[Tokyo Population Estimate (as of June 1, 2026) — Key Figures]
Total population: 14,299,726 (male 6,993,431; female 7,306,295). Down 1,542 from the previous month; up 67,706 (+0.48%) year on year versus 14,232,020; up 142,408 (+1.01%) over two years versus 14,157,318.
By area (population, YoY): 23 wards 9,994,374 (+0.56%); Tama city area 4,230,882 (+0.32%); rural districts 52,792 (-0.92%); island areas 21,678 (-2.25%).
Two-year comparison (vs prior year / vs two years prior): 23 wards +0.56% / +1.35%; city area +0.32% / +0.27%; rural -0.92% / -2.11%; islands -2.25% / -5.04%.
Total households about 7.636 million. Population density is highest in the central wards.
(This is a summary translation of figures published by the Tokyo Metropolitan Government; original figures prevail.)