Analysis: Profit Rain Falls Only on the Big Roof in Q1 26A · FULL TRANSLATION
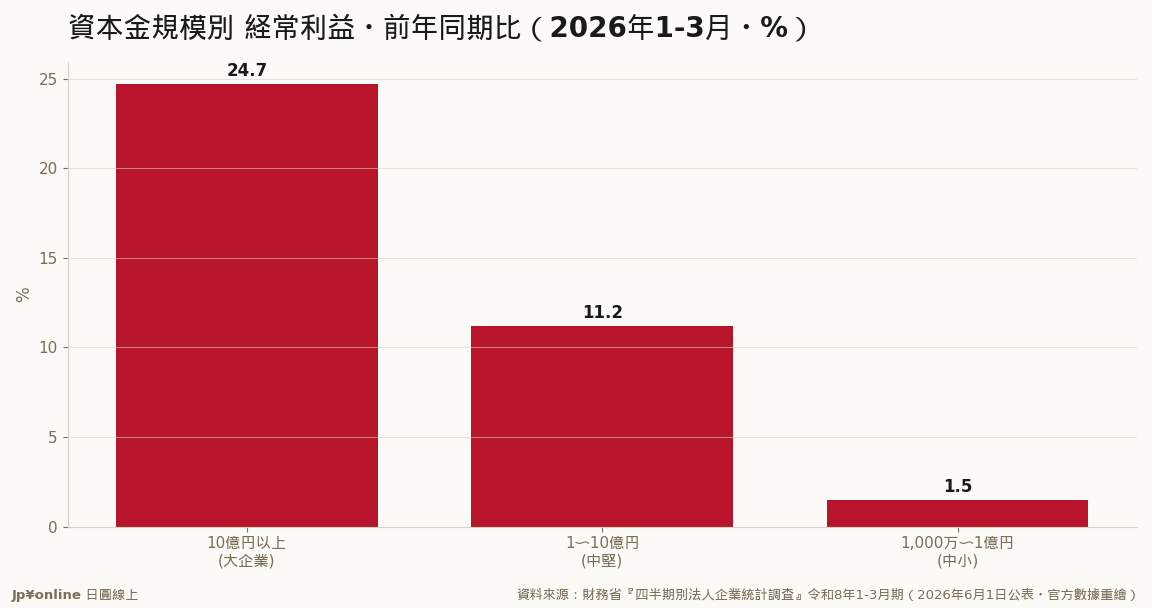
- Operating profits for large companies +24.7% (¥17.3061 trillion), medium-sized companies +11.2% (¥5.9048 trillion), and small companies +1.5% (¥9.4162 trillion) = 14.6% new high almost entirely contributed by large companies
- Profit margin gap: Large companies at 10.3% (up from 8.4% last year) vs medium-sized companies at 6.4% unchanged; sales growth for large +1.7%, medium -1.5%, and small +2.1% = revenue growth sluggish, profit disparity lies in AI and exchange rate allocation
- Industry comparison: Information communication machinery operating profits up by 174.7%, highest overall margin at 24.1% (AI memory); electrical machinery turns to loss -108.2%, construction down -5.9%
- Investment structure split: Large companies +0.9%, medium-sized -5.2%, small companies +2.9%; total +0.05% lost momentum = deeper divide in investment intentions; capital adequacy ratio for small companies 46.9% > large companies 42.5% = cash on hand but cautious due to demand visibility and cost passing
- Taiwan Insights: Large manufacturing × AI supply chain and small domestic demand are two distinct profit worlds, valuation gap has a solid basis; can information communication machinery maintain triple digits in the next quarter directly foretells Taiwan's export momentum
The Ministry of Finance’s Q1 26 corporate statistics cut into three segments by capital: operating profits for large companies (over ¥10 billion) up +24.7% to ¥17.3061 trillion, medium-sized companies (¥1-10 billion) up +11.2% to ¥5.9048 trillion, and small companies (¥10 million - ¥1 billion) up only +1.5% to ¥9.4162 trillion; profit margins for large companies at 10.3% (up from 8.4% last year), medium-sized companies unchanged at 6.4%. Revenue growth was minimal across all segments: large companies +1.7%, medium-sized -1.5%, and small companies +2.1%. The disparity in profits lies not in how much they sell, but who gets a share of AI and exchange rate benefits.
Conclusion: The Ministry of Finance’s Q1 26 corporate statistics show a record-breaking operating profit increase of +14.6% across all industries, as previously reported on this site. Dividing the same report into three segments by capital reveals stark differences – large companies (over ¥10 billion) up +24.7%, medium-sized companies (¥1-10 billion) up +11.2%, and small companies (¥10 million - ¥1 billion) only up +1.5%. The 'profit rain' falls almost entirely on the big roof.
Breaking down the numbers, comparing amounts and profit margins side by side: large companies’ operating profits at ¥17.3061 trillion, sales profit margin 10.3% (up from 8.4% last year), medium-sized companies at 6.3%, small companies at 6.4% (unchanged from the previous year). Sales growth was more honest: large companies up +1.7%, medium-sized -1.5%, and small companies up +2.1%. The profit disparity lies in who gets a share of AI and exchange rates. Industry comparison shows information communication machinery operating profits up by 174.7% (AI data centers toward memory semiconductors), highest overall margin at 24.1%; electrical machinery up by 42.3%, while the electrical industry turns to loss -108.2%, and construction down -5.9%. The main players in the AI chain are almost exclusively large companies.
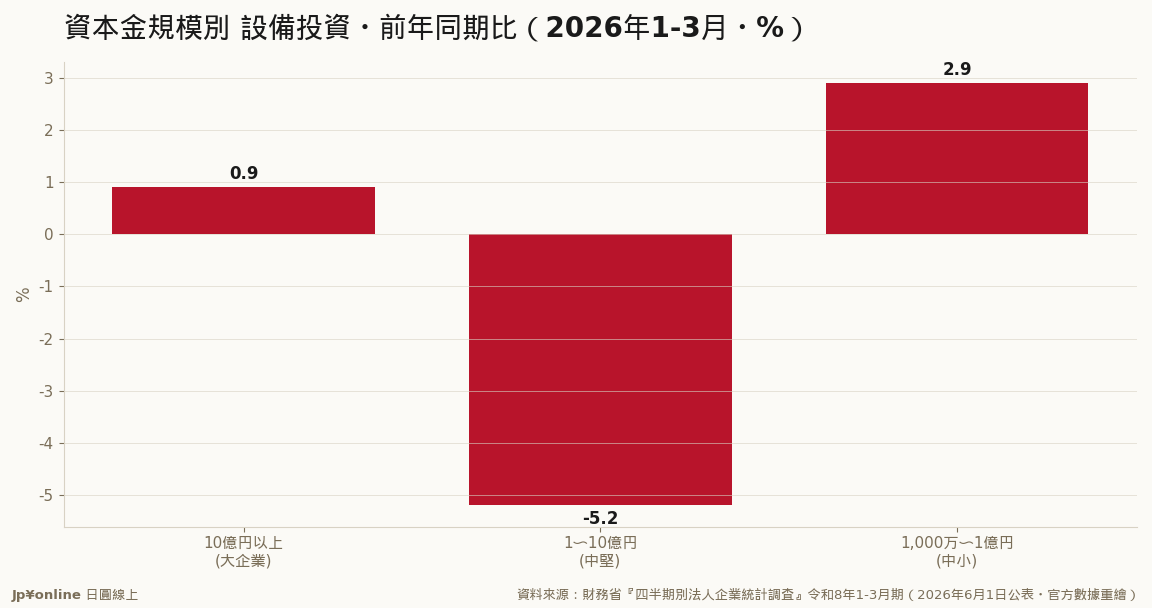
The investment structure split is even more pronounced, with large companies up +0.9%, medium-sized -5.2%, small companies up +2.9%; total +0.05% lost momentum (previously covered in GDP second estimate revisions). The middle tier cut back first, corroborated by the Bank of Japan’s June Tankan survey showing a 11.5% increase for large companies and -8.3% for medium-sized companies in capital expenditure plans for fiscal year 2026. A commonly misunderstood number: small companies’ capital adequacy ratio at 46.9%, > medium-sized companies at 44.0%, > large companies at 42.5%. Small companies have cash reserves but are cautious due to demand visibility and cost passing challenges (as indicated by the high 76 reading on medium-sized companies’ input price DI).
For Taiwanese readers, first, the 'big-small' divide in the market has a solid basis: large manufacturing × AI supply chains versus small domestic businesses represent two distinct profit worlds. The valuation gap between TOPIX large and small indices is not just about style factors; do not rush to bet on mean reversion. Second, Taiwan’s semiconductor and equipment supply chain counterparts are information communication machinery +174.7% – can it maintain triple digits in the next quarter directly foretells Taiwan's export momentum. Third, medium-sized companies’ capital expenditure -5.2% is a short-term headwind for FA and machine tools but the historical-level labor shortage (employment DI at -37) is a long-term tailwind; the time difference between these two factors is an opportunity to study entry timing. What to watch: 1) The September 1 release of the Q4-Q6 period, with US tariff costs factored in, how much will large companies’ manufacturing operating profits remain at +42.9%; 2) the September Tankan survey’s upward revision for medium-sized companies’ capital expenditure plans; 3) whether small companies can break out of the 6% profit margin.