Japan Corporate Goods Prices, June 2026: Import Prices Up 29.7%, With 11.9 Points From the Weak Yen AloneA · FULL TRANSLATION
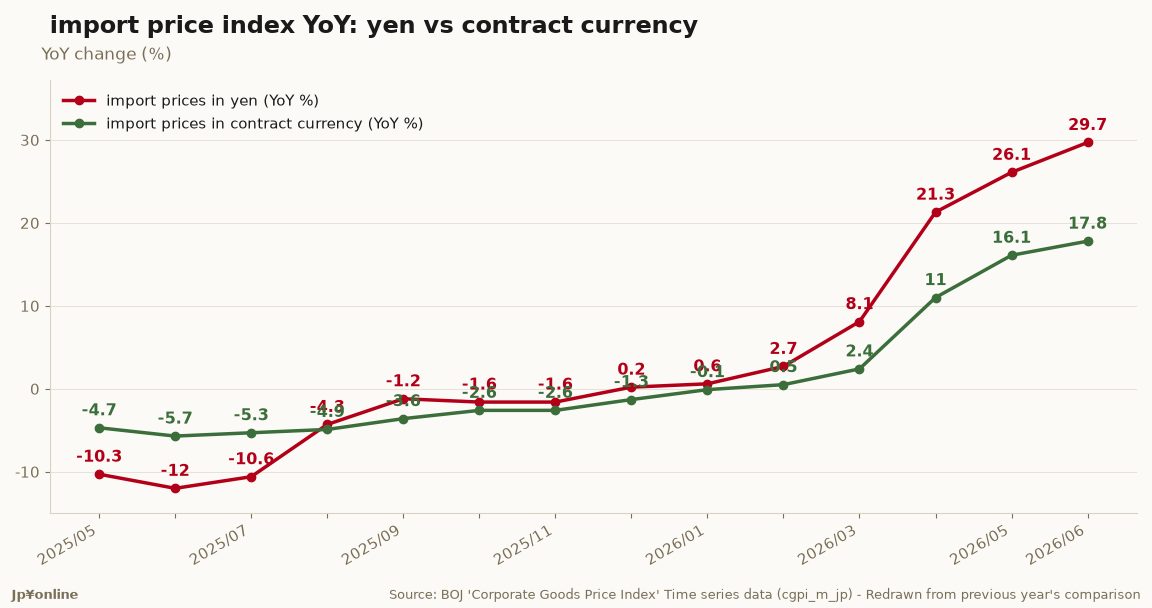
- The June 2026 preliminary release came out on 10 July at 8:50 JST. Import prices rose 29.7% year on year in yen terms and 17.8% in contract-currency terms. The 11.9-point difference is the contribution of the exchange rate.
- A year earlier the sign was reversed. In June 2025 import prices fell 12.0% in yen terms and 5.7% in contract-currency terms, an exchange rate contribution of −6.3 points. The swing over twelve months is 18.2 points.
- The remaining 17.8 points reflect the goods themselves. Japan's import cost increase is driven by currency and commodity markets at the same time.
- Domestic corporate goods prices rose 7.1% year on year (0.4% on the month), index 135.4. Petroleum and coal products rose 22.8%, non-ferrous metals 39.2% and chemicals 14.4%.
- Export prices rose 20.7% in yen terms and 11.1% in contract-currency terms, an exchange rate contribution of 9.6 points. The dollar-yen rate for the month was 160.8, up 1.5% from May.
The Bank of Japan publishes import and export prices on two bases at once: in yen, and in contract currency, meaning the currency actually written into the deal, usually the dollar. Subtract one from the other and you isolate what the exchange rate alone did to prices. Few official datasets let you cut the currency effect out this cleanly.
For June 2026 the answer is 11.9 points. Import prices rose 29.7% in yen and 17.8% in contract currency. Priced in dollars, what Japan buys got 17.8% more expensive; converted to yen, buyers paid 29.7% more. The difference is the weaker yen.
A year ago the same calculation gave −6.3 points, with a firmer yen holding import costs down. The swing across twelve months is 18.2 points.
The other half matters too. The 17.8% contract-currency rise shows goods are genuinely more expensive, so this cannot all be blamed on the currency. Within June, petroleum, coal and natural gas contributed −0.32 points month on month while electrical and electronic equipment added 0.18.
For readers watching travel and living costs, the point is timing. Import prices sit furthest upstream, then domestic corporate goods prices at 7.1%, and only later consumer prices, which are still running near 1%. If pass-through follows past patterns, the pressure shows up in Japanese retail prices later this year.
This site tracks the currency contribution in points from this month onward.
Translated from the Bank of Japan Research and Statistics Department, "Corporate Goods Price Index (June 2026, preliminary)," released 10 July 2026 at 8:50 JST. Indices are 2020 average = 100.
SUMMARY. The domestic corporate goods price index rose 0.4% from the previous month (7.1% year on year). Export prices fell 0.4% month on month in contract-currency terms and rose 0.4% in yen terms (20.7% year on year). Import prices rose 0.1% month on month in contract-currency terms and 1.3% in yen terms (29.7% year on year).
JUNE INDEX LEVELS. Domestic corporate goods prices 135.4; export prices 162.6 in yen and 123.8 in contract currency; import prices 196.6 in yen and 142.5 in contract currency; reference dollar-yen rate 160.8.
RECENT MONTHS, YEAR ON YEAR. Domestic corporate goods prices: January 2026 +2.4, February +2.1, March +2.9, April +5.4, May +6.6, June +7.1. Import prices in yen: January +0.6, February +2.7, March +8.1, April +21.3, May +26.1, June +29.7. Import prices in contract currency: January −0.1, February +0.5, March +2.4, April +11.0, May +16.1, June +17.8.
MAIN CONTRIBUTORS TO MONTH-ON-MONTH CHANGE.
Domestic corporate goods prices (+0.4%): petroleum and coal products +0.21 points (heavy fuel oil B and C, gas oil, gasoline); electric power, city gas and water +0.09 (commercial electricity, city gas); plastic products +0.05; other manufacturing +0.02; lumber and wood products +0.02; pulp, paper and related +0.02; iron and steel +0.02; production machinery +0.01; chemicals +0.01. Agriculture, forestry and fisheries −0.11 (polished rice, brown rice, pork).
Export prices, contract currency (−0.4%): other primary and manufactured goods −0.52 (gas oil, jet fuel and kerosene, gasoline); metals and related −0.20 (gold bullion, precious metal products, scrap iron); chemicals −0.17. Electrical and electronic equipment +0.44 (MOS memory integrated circuits, industrial instruments, sensor devices); general, production and business machinery +0.08.
Import prices, contract currency (+0.1%): electrical and electronic equipment +0.18 (display and terminal devices, external storage, recording media); metals and related +0.12 (copper ore, aluminium ingots, pipe fittings); food and agricultural products +0.06 (tobacco, wheat, feed crops); general, production and business machinery +0.04; other goods +0.03; chemicals +0.01. Petroleum, coal and natural gas −0.32 (LNG, jet fuel, kerosene).
DOMESTIC PRICES BY MAJOR GROUP, YEAR ON YEAR. Food and beverages +4.0; textiles +1.3; lumber and wood products +8.0; pulp and paper +5.2; chemicals +14.4; petroleum and coal products +22.8; plastic products +7.3; ceramics and stone +5.5; iron and steel −0.4; non-ferrous metals +39.2.
NOTE. A negative sign on the exchange rate indicates yen appreciation. "r" denotes a revised figure.