BOJ Tankan June 2026: Firms Budget FY2026 at 152.57 Yen While June Averaged 160.69, a Gap of 8.1 YenA · FULL TRANSLATION
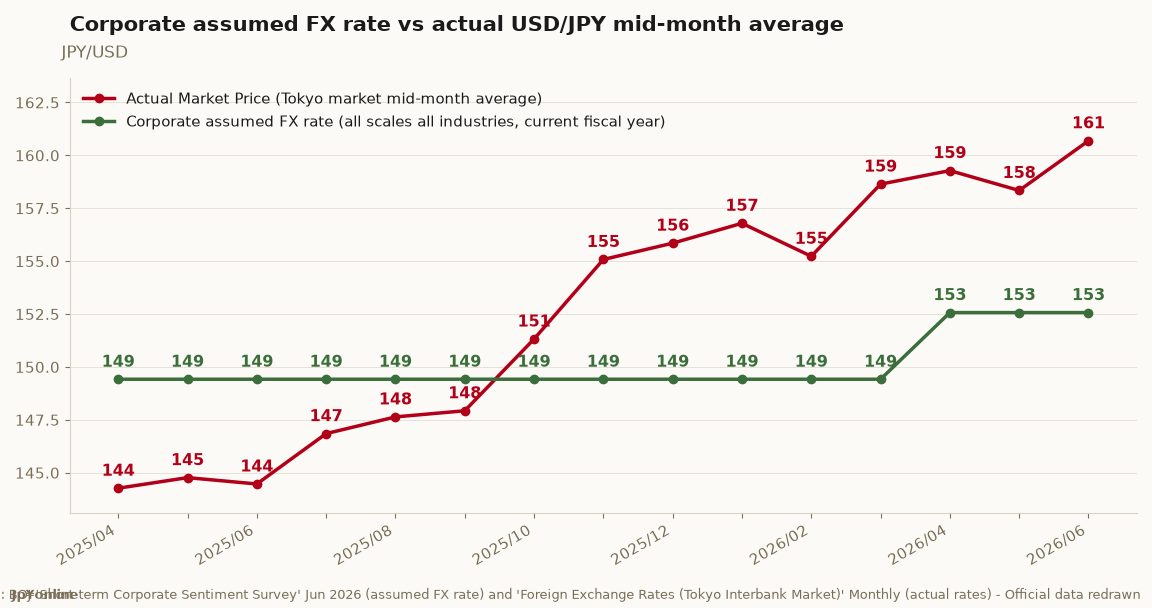
- In the June 2026 Tankan (released 1 July), all enterprises across all industries assume 152.57 yen per dollar for fiscal 2026, split 152.62 first half and 152.51 second half. The euro assumption is 175.62 yen.
- Actual rates over the same period: the BOJ's Tokyo market dollar-yen spot averaged 160.69 in June, ending the month at 162.26 with a high of 162.41. Corporate budgets assume a yen 8.12 stronger than the market delivered.
- Exporters show a wider gap. Large manufacturing exporters assume 151.49 for fiscal 2026, 9.20 yen away from June's average. On the euro, firms assume 175.24 against an actual monthly average of 185.11 (ECB), a gap of 9.87 yen.
- Firms keep revising. The fiscal 2026 assumption moved from 150.10 in the March survey to 152.57 in June, up 2.47 yen; exporters moved from 148.88 to 151.49. A year earlier, the fiscal 2025 assumption was just 145.72.
- Fiscal 2026 capital spending plans for large enterprises across all industries stand at +11.5% year on year, revised up 7.2 points from +3.3% in March. The same survey puts fiscal 2026 recurring profit plans at −6.5% for all enterprises.
The assumed exchange rate is what companies write into their annual budgets. It is not a forecast but a financial premise: revenue, cost and profit targets all hang on it. How far it sits from the market therefore decides whether results beat or miss plan.
This quarter the gap is plain. All enterprises set 152.57 for fiscal 2026 against an actual June average of 160.69, a difference of 8.12 yen. Large manufacturing exporters set 151.49, a gap of 9.20 yen. The BOJ's daily series stood at 162.28 on 15 July, so the gap is still widening.
The direction favours exporters: a weaker yen than budgeted means every unit of overseas earnings converts to more yen than planned. Importers and domestic retailers sit on the other side of the same trade.
Firms are chasing the market rather than leading it. The fiscal 2026 assumption moved from 150.10 to 152.57 in three months, and a year ago the fiscal 2025 assumption was only 145.72.
The capex and profit plans together say something else. Large enterprises plan +11.5% capital spending for fiscal 2026, sharply revised up, while recurring profit plans sit at −6.5%. Part of that conservatism comes from budgeting a stronger yen than the market is delivering. If the yen holds above 160, reported profits have room to beat plan.
This site tracks the gap between assumption and market from this quarter onward.
Translated from the Bank of Japan Research and Statistics Department, "Tankan (Summary) — June 2026" (209th Short-Term Economic Survey of Enterprises in Japan), released 1 July 2026; exchange rate and capital investment sections.
REFERENCE: ASSUMED EXCHANGE RATES UNDERLYING BUSINESS PLANS (all enterprises, all industries)
Yen per US dollar. March 2026 survey: fiscal 2025, 148.29 (first half 146.97, second half 149.60); fiscal 2026, 150.10 (150.10, 150.09). June 2026 survey: fiscal 2025, 149.42 (147.27, 151.58); fiscal 2026, 152.57 (152.62, 152.51).
Yen per euro. March 2026 survey: fiscal 2025, 167.14 (164.60, 169.68); fiscal 2026, 171.77 (171.72, 171.83). June 2026 survey: fiscal 2025, 169.13 (165.12, 173.14); fiscal 2026, 175.62 (175.68, 175.56).
REFERENCE: ASSUMED EXCHANGE RATES OF EXPORTING FIRMS (large enterprises, manufacturing)
Yen per US dollar. March 2026 survey: fiscal 2025, 147.87 (146.78, 148.96); fiscal 2026, 148.88 (148.90, 148.87). June 2026 survey: fiscal 2025, 149.44 (146.94, 151.94); fiscal 2026, 151.49 (151.60, 151.38).
Yen per euro. March 2026 survey: fiscal 2025, 167.14; fiscal 2026, 170.87. June 2026 survey: fiscal 2025, 169.55; fiscal 2026, 175.24.
IV. FIXED INVESTMENT PLANS. Fixed investment including land, year-on-year percent change.
Large enterprises: manufacturing, fiscal 2025 +10.6% (revision −1.4), fiscal 2026 +10.1% (+5.6). Non-manufacturing, fiscal 2025 +9.8% (−0.3), fiscal 2026 +12.3% (+8.0). All industries, fiscal 2025 +10.1% (−0.7), fiscal 2026 +11.5% (+7.2).
Medium-sized enterprises: all industries, fiscal 2025 +9.5% (+1.2), fiscal 2026 +6.0% (+3.8). Small enterprises: all industries, fiscal 2025 +6.9% (+9.4), fiscal 2026 −8.3% (+9.1).
All enterprises: manufacturing, fiscal 2025 +9.5%, fiscal 2026 +7.5%. Non-manufacturing, fiscal 2025 +9.3%, fiscal 2026 +6.4%. All industries, fiscal 2025 +9.4% (revision +1.4), fiscal 2026 +6.8% (+6.8). All industries including financial institutions, fiscal 2025 +9.1%, fiscal 2026 +6.9%.
III. SALES AND PROFIT PLANS. Recurring profits, year-on-year percent change: large enterprises all industries, fiscal 2025 +5.1% (revision +4.3), fiscal 2026 −6.5% (−0.7). All enterprises all industries, fiscal 2025 +7.1% (+5.1), fiscal 2026 −6.5% (+0.6). Sales: large enterprises all industries, fiscal 2025 +2.1%, fiscal 2026 +3.7%.
NOTE. Fixed investment figures are on a basis including land and excluding software. Revision rates are measured against the previous survey.