Japan Room Occupancy Slips to 56.2% in June 2026; Ryokan the Only Segment Still RisingA · FULL TRANSLATION
- National room occupancy was 56.2% in June 2026, down 2.6 points year on year, after 61.0% (-0.7pt) in May's second preliminary
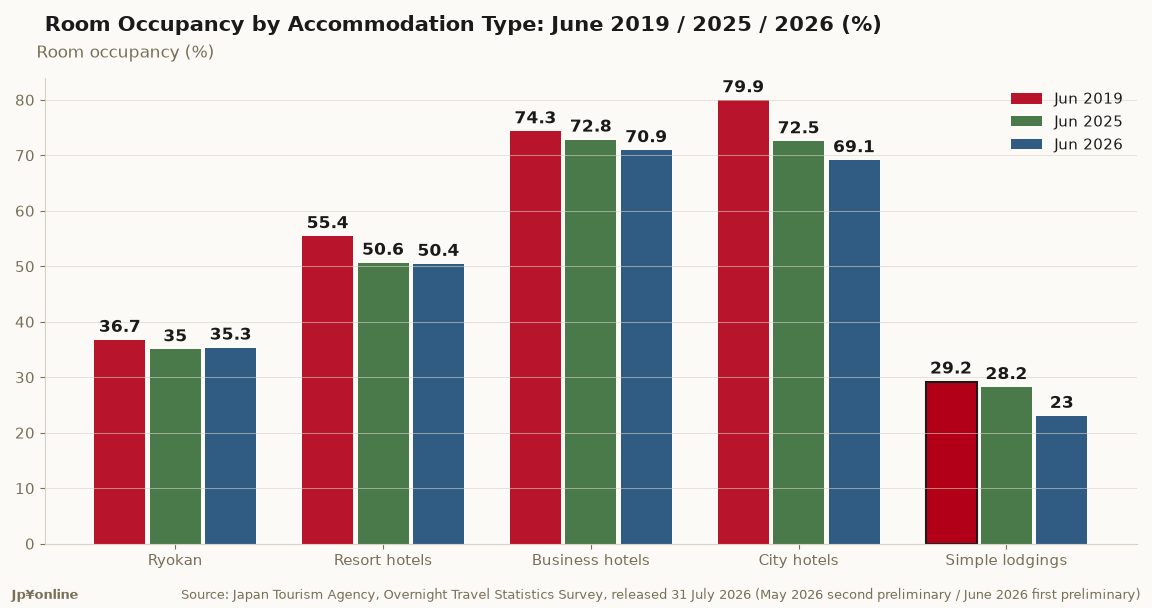
- Only ryokan rose in June: ryokan 35.3% (+0.3pt), resort hotels 50.4% (-0.2pt), business hotels 70.9% (-1.9pt), city hotels 69.1% (-3.4pt), simple lodgings 23.0% (-5.2pt)
- May figures reported here last month (60.6% overall, 41.7% ryokan) were revised to 61.0% and 41.5% in the second preliminary
- Prefectures above 80% occupancy in May: resort hotels 1 (0 a year earlier), business hotels 2 (4), city hotels 1 (3) — the high-occupancy map keeps shrinking
- Tokyo led the country at 77.9% overall occupancy in May
Last month this series reported national room occupancy of 60.6% for May on the first preliminary. The second preliminary revised May to 61.0% (-0.7pt year on year), and the newly added June first preliminary comes in at 56.2%, down 2.6 points. The decline widened sharply between the two months.
By segment in June: ryokan 35.3% (+0.3pt), resort hotels 50.4% (-0.2pt), business hotels 70.9% (-1.9pt), city hotels 69.1% (-3.4pt) and simple lodgings 23.0% (-5.2pt). Last month's story was a scissors pattern — Japanese-style properties rising while Western-style urban hotels fell. In June that pattern has largely collapsed into a broad decline, with ryokan the only segment still marginally positive and resort hotels slipping into negative territory.
Simple lodgings took the deepest cut at -5.2 points. This segment covers minpaku, hostels and capsule-style accommodation, whose guest mix overlaps heavily with independent foreign travellers; foreign guest nights fell 11.9% in June. Business hotels remain the strongest segment in absolute terms at 70.9%, supported by domestic corporate travel.
From the May data, prefectures with occupancy above 80% numbered just one for resort hotels, two for business hotels and one for city hotels, against zero, four and three a year earlier. Tokyo led the nation at 77.9%. Compared with June 2019 — 60.6% nationally and 79.9% for city hotels — the urban hotel segment remains more than ten points below its pre-pandemic level.
Japan Tourism Agency, 31 July 2026 — occupancy sections of the Overnight Travel Statistics Survey (May 2026 second preliminary, June 2026 first preliminary):
Room occupancy. The overall occupancy rate was 61.0% in May 2026 and 56.2% in June 2026. In May 2026, prefectures recording occupancy above 80% numbered one for resort hotels (zero a year earlier), two for business hotels (four a year earlier) and one for city hotels (three a year earlier). Tokyo posted the highest overall occupancy in the country at 77.9%. June figures are first preliminary and may be revised in the second preliminary due on 31 August 2026.
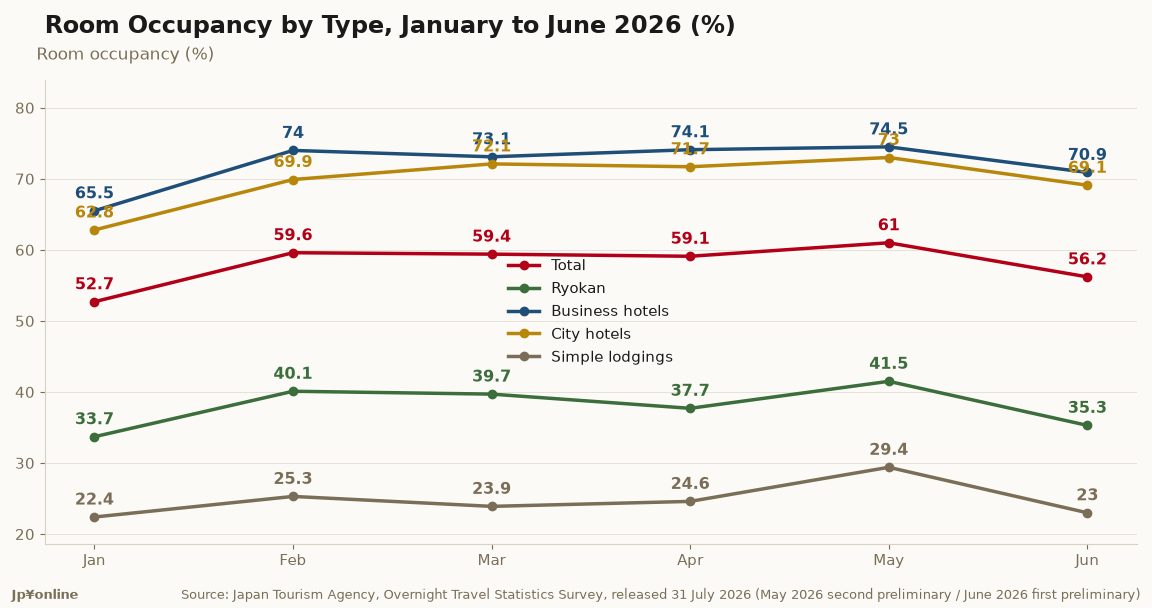
Occupancy by accommodation type, 2026 (%): January — overall 52.7, ryokan 33.7, resort hotels 51.1, business hotels 65.5, city hotels 62.8, simple lodgings 22.4. February — 59.6 / 40.1 / 58.4 / 74.0 / 69.9 / 25.3. March — 59.4 / 39.7 / 58.8 / 73.1 / 72.1 / 23.9. April — 59.1 / 37.7 / 53.7 / 74.1 / 71.7 / 24.6. May — 61.0 / 41.5 / 58.4 / 74.5 / 73.0 / 29.4. June — 56.2 / 35.3 / 50.4 / 70.9 / 69.1 / 23.0.
Year-earlier months (2025): May — 61.7 / 38.5 / 54.3 / 75.7 / 75.0 / 29.7. June — 58.8 / 35.0 / 50.6 / 72.8 / 72.5 / 28.2.
Annual final figures: 2019 — 62.7 / 39.6 / 58.5 / 75.8 / 79.5 / 33.4. 2024 — 59.6 / 36.1 / 54.1 / 73.7 / 72.3 / 29.0. 2025 — 61.6 / 38.2 / 56.9 / 75.3 / 74.1 / 29.6.
Notes: from the second quarter of 2010 the survey was expanded to include establishments with fewer than ten employees. Figures for 2007-2025 are final, January-May 2026 are second preliminary, and June 2026 is first preliminary. Year-on-year differences are calculated against final values.