Central Tokyo Premium Tracker, July 2026: Six Central Wards Fall a Fifth Month to ¥166.74M as Outer Wards Hit a Record
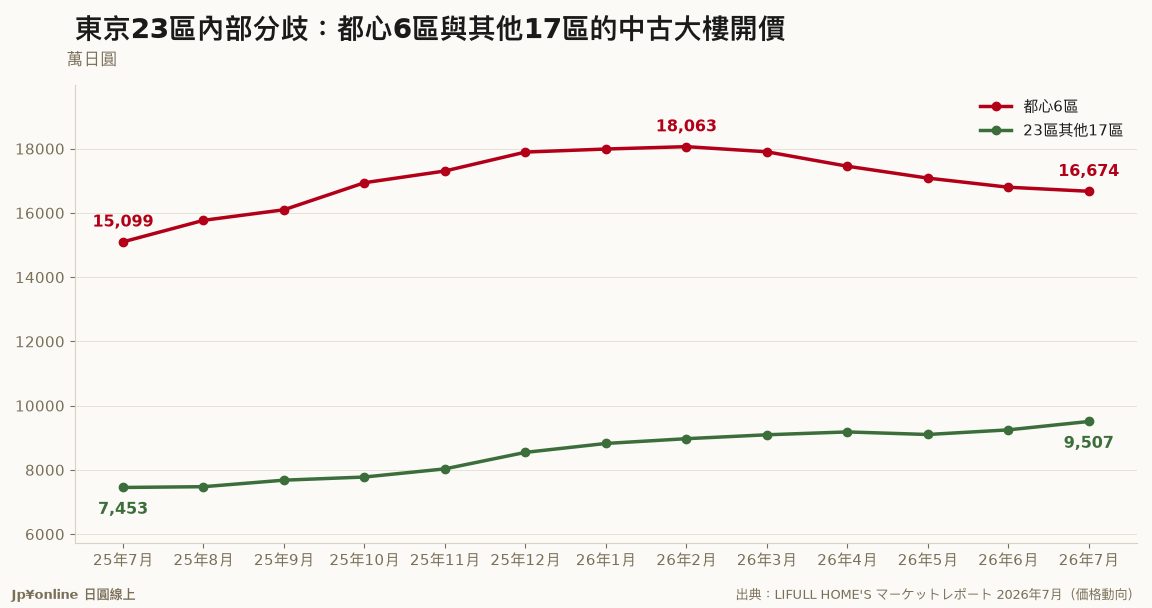
- Asking prices for family-type used condominiums in Tokyo's six central wards (Chiyoda, Chuo, Minato, Shinjuku, Bunkyo, Shibuya) fell from ¥168.00M in June to ¥166.74M in July, down ¥1.26M (-0.8%) — a fifth consecutive monthly decline.
- From the February peak of ¥180.63M, five months have taken ¥13.89M off the average, a drop of 7.7%.
- Over the same month the other 17 wards rose from ¥92.46M to ¥95.07M (+2.8%), the highest reading in this series — the 23 wards are now moving in opposite directions.
- The central-to-outer price ratio narrowed from 1.82 to 1.75, the tightest in a year.
- Year on year the six central wards are up 10.4% while the outer wards are up 27.6%; the catch-up is happening outside the core.
- Average floor area of central listings edged from 71.6 to 71.1 sqm and average building age from 23.2 to 23.0 years, so the price decline is not a shift toward smaller units.
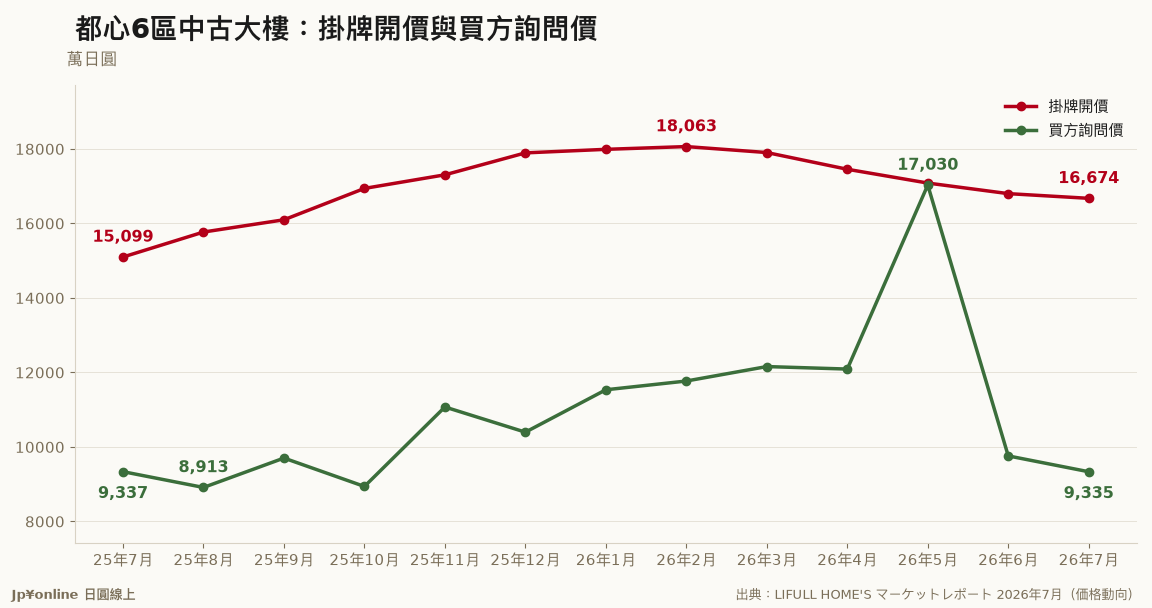
- Inquiry prices in the six central wards fell from ¥97.60M to ¥93.35M (-4.4%), moving the same way but harder.
- Gap this month: the price-band breakdown used last time is published quarterly and is absent from the monthly dataset, so it is recorded as not published.
Asking prices for family-type used condominiums in Tokyo's six central wards were ¥168.00M in June and ¥166.74M in July, down ¥1.26M or 0.8%. Last month we recorded a fourth consecutive decline; this makes five. From February's peak of ¥180.63M, five months have removed ¥13.89M, or 7.7%.
The number that matters is not how far the centre fell but what the rest of the city did in the same month. The other 17 wards rose from ¥92.46M to ¥95.07M, up 2.8% and the highest reading in this series. The first chart puts both lines together: after a year of rising in step, they have separated.
Year on year the split is clearer still — up 10.4% in the six central wards against 27.6% outside them. The catch-up is happening in the outer ring, not the core. The central-to-outer ratio has narrowed from 1.82 to 1.75, the tightest in a year. LIFULL's note that western Tokyo family units broke ¥40M for the first time is the same story seen from the far end.
Could a change in the mix of listings explain the fall? The structure says no: average floor area went from 71.6 to 71.1 sqm and average building age from 23.2 to 23.0 years. The second chart compares central asking prices with central inquiry prices, and the inquiry side fell 4.4% to ¥93.35M — sellers are conceding, buyers are retreating faster.
One gap to declare: the price-band breakdown we used last time is a quarterly item and is absent from this monthly release, so it is logged as not published until the next quarterly report.
Previous instalment: 【都心高價帶追蹤|2026年Q2】都心6區開價四連跌至1億6,800萬円,1億-1.5億円台物件滯留壓低均價 https://jpyonline.pages.dev/article/2026-07-24-47-central-tokyo-premium-tracker-2026q2-asking-prices-fall/