Greater Tokyo's Median New-Build Condo Price Jumps 14.6% in Half a Year to ¥80.4m: Chiba Leaps 28.4%, Saitama Barely Moves
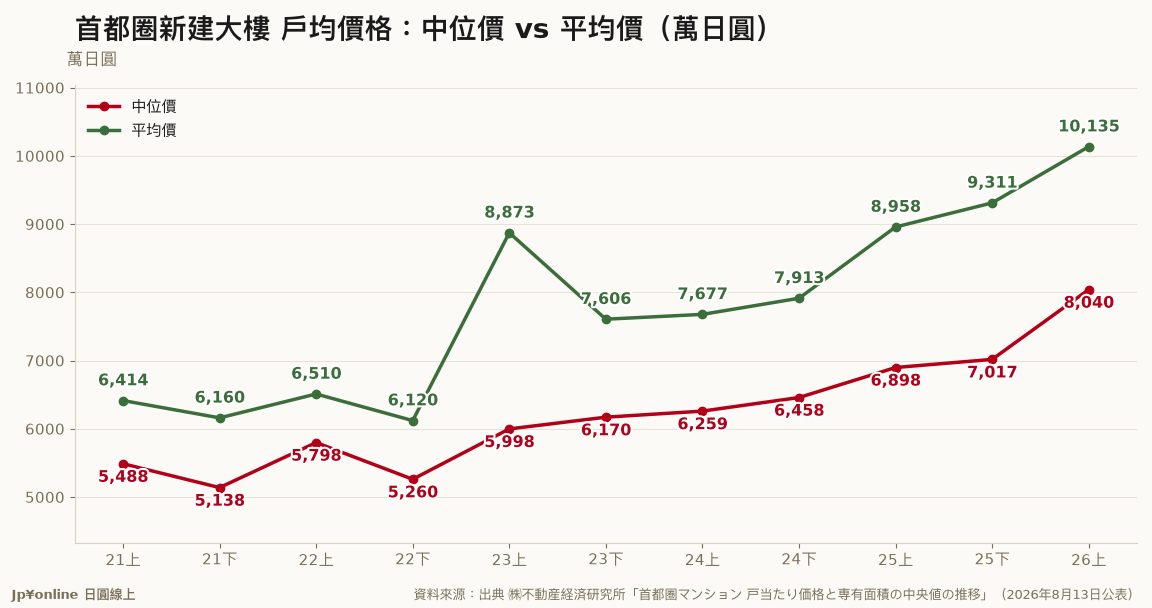
- The median price of a new-build condominium in Greater Tokyo (Tokyo plus Kanagawa, Saitama and Chiba) reached ¥80.4m in the first half of 2026, up ¥10.23m or 14.6% from ¥70.17m in the second half of 2025 — the first time it has entered the ¥80m range.
- On a half-yearly basis the median has now risen for seven consecutive periods since the first half of 2023. It is 16.6% above the same half last year (¥68.98m) and 46.5% above the first half of 2021 (¥54.88m).
- The average price for the same period was ¥101.35m, ¥20.95m above the median: averages are pulled up by ultra-expensive central Tokyo units, while the median is closer to what an ordinary buyer actually faces.
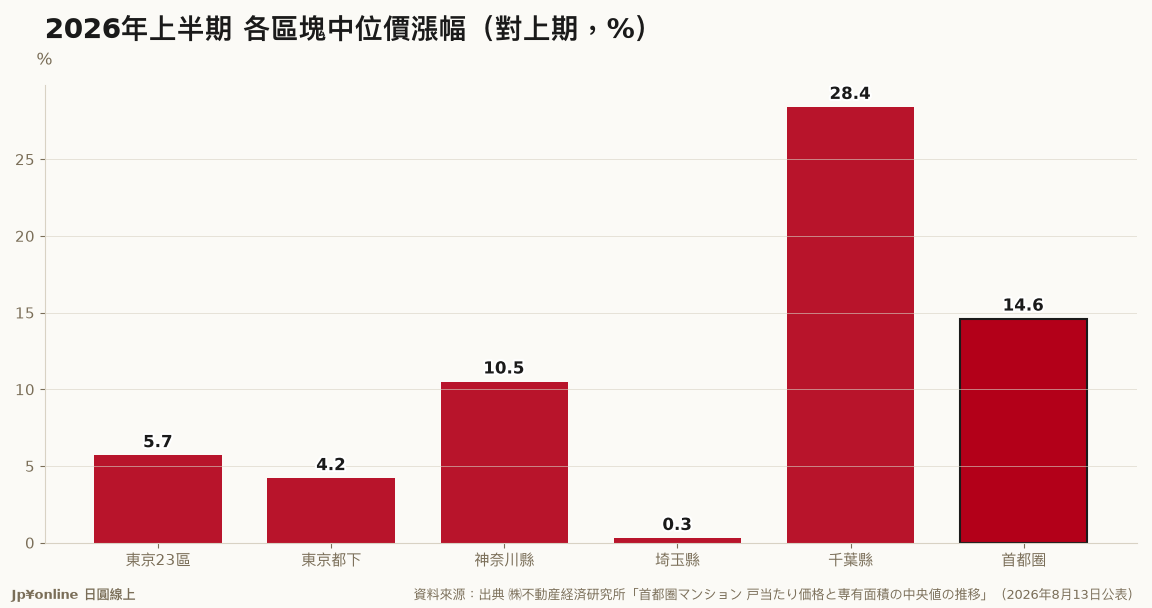
- All five areas rose, but by wildly different margins: Chiba ¥68.68m (+28.4% on the previous half), Kanagawa ¥72.9m (+10.5%), Tokyo's 23 wards ¥121.53m (+5.7%), western Tokyo ¥67.7m (+4.2%) and Saitama ¥59.18m (+0.3%).
- The publisher attributes the rise to labour costs climbing since the construction industry's "2024 problem", plus materials and land costs rising across every area; 2,783 units priced above ¥100m were released in Greater Tokyo in the half.
The half-yearly release from the Real Estate Economic Institute on 13 August exposes a number averages usually hide. The median new-build condominium in Greater Tokyo cost ¥80.4m in the first half of 2026, up ¥10.23m or 14.6% from ¥70.17m in the second half of 2025 — its first move into the ¥80m range.
Four benchmarks: up 14.6% on the previous half, up 16.6% on the same half a year earlier (¥68.98m), and up 46.5% on the first half of 2021 (¥54.88m). The pre-pandemic comparison is not available — the table starts from 2021 — and we do not estimate what is not published. The median has risen seven periods in a row.
The choice of indicator is the point. The average was ¥101.35m, ¥20.95m above the median, a gap created by a handful of ultra-expensive central Tokyo units. The familiar defence — that only towers are rising and they drag the average with them — no longer holds when the median itself climbs 14.6%.
The spread between areas matters more than the headline. Chiba's median rose 28.4% to ¥68.68m, while Saitama moved 0.3% to ¥59.18m. One caveat on Chiba: its average jumped from ¥59.04m to ¥89.97m, far more than the median, which usually signals a cluster of large high-end launches. One prefecture in one half is not a trend.
The cause given is common to every area: labour costs rising since the construction industry's "2024 problem", with materials and land costs climbing alongside. The increase has reached the middle of the market, not just the top of it.