December 2025: Greater Tokyo’s Pre-Owned Apartments See Sales Surge, Inventory Bottoms OutA · FULL TRANSLATION
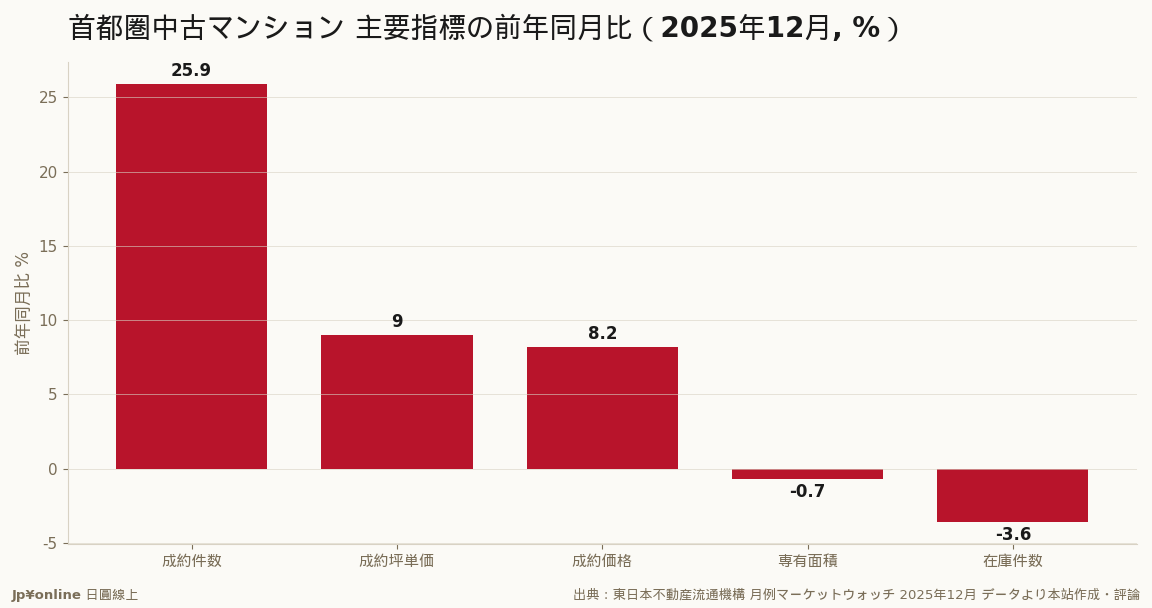
- Sales volume of 3,975 units (up 25.9% year-over-year), 14 consecutive months of growth
- Inventory at 43,381 units (down 3.6% year-over-year), five consecutive months of decline
- Average sale price up to 53,400,000 yen (+8.2%), per-square-meter price up to 2,807,000 yen (+9.0%) for 68 consecutive months
- Inventory decrease and sales volume increase indicate seller's market
In December 2025, the Greater Tokyo pre-owned apartment market reported a surge in both volume and price with inventory at its lowest levels for 14 consecutive months. The number of sales reached 3,975 units, up by 25.9% year-over-year. The average sale price was 53,400,000 yen (up 8.2%), while the per-square-meter price hit 2,807,000 yen and continued to rise for 68 consecutive months. Inventory dropped by 3.6% year-over-year for five consecutive months. With more buyers chasing fewer properties, sellers have the upper hand in the market.
【Conclusion First】In December 2025, the Greater Tokyo pre-owned apartment market delivered a performance report of rising sales volume and prices alongside dwindling inventory: sales reached 3,975 units (up 25.9% year-over-year) for 14 consecutive months, with an average price of 53,400,000 yen (+8.2%) and a per-square-meter price of 2,807,000 yen (+9.0%, up for 68 consecutive months). Inventory decreased by 3.6% year-over-year for five consecutive months. With more buyers chasing fewer properties, the market is favorable to sellers in Greater Tokyo.
【Decoding Key Indicators】 ‘Sales volume’ refers to actual transactions and directly reflects buyer interest; ‘Average per-square-meter price/total sale price’ indicates price levels; ‘Inventory quantity’ represents available stock on the market. Fewer inventory pieces mean fewer property choices, giving sellers more leverage.
【Breaking Down the Numbers: Buyers and Sellers in Action】This data highlights two significant points: 1) A 25.9% increase in sales volume with a 3.6% decrease in inventory—buyers are chasing properties while the available stock is dwindling, tilting supply-demand dynamics in favor of sellers, explaining the 68-month price rise. 2) The average private area decreased by 0.7%, to 62.77 square meters. Prices rose but areas shrunk, suggesting buyers opt for smaller units despite higher prices. This indicates that part of the price increase is due to buying smaller spaces. The per-square-meter price has risen for 68 consecutive months since May 2020, signaling a rare long-term trend in the market.
【Counter-Views】While sellers are benefiting, there are concerns: 1) The surge in sales volume may be driven by last-minute purchases before regulatory and tax changes kick in. These transactions might not continue into the new year. 2) A 68-month price rise signals increased risk: as prices diverge from affordability, buyer momentum could slow down. 3) Pre-owned apartments are sensitive to interest rates; any Bank of Japan rate hikes will quickly affect buyer affordability.