Japan Land Valuation 2026: 44 of 47 Capital Cities Rise, None Fall, and Ginza's +11.0% Ranks Only FifthA · FULL TRANSLATION
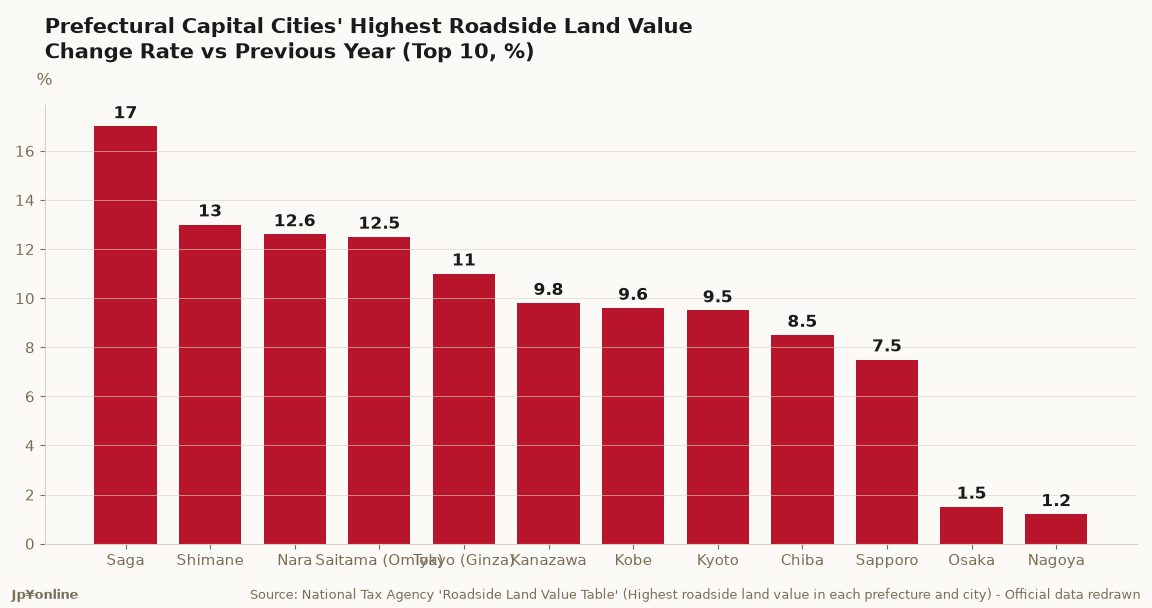
- The National Tax Agency published the 2026 (Reiwa 8) rosenka on 1 July. The press release carries a single attachment, an appendix table of the highest roadside land value in each of the 47 prefectural capital cities with year-on-year change rates; no national average figure appears in the released document.
- Of the 47 cities in the table, 44 rose year on year, three were unchanged (Aomori, Tsu, Tottori) and none declined. The prior-year column of the same table shows 35 rising, 11 unchanged and one falling (Tottori).
- The highest value is Ginza Chuo-dori, Ginza 5-chome, Chuo Ward, Tokyo, at 53,360 thousand yen per square metre (48,080 a year earlier), up 11.0%. The lowest is Wakasa Kaido-dori, Sakae-machi, Tottori City, at 91 thousand yen, a gap of 586 times.
- The largest increase is Saga City's Ekimae-chuo-dori at +17.0% (from +9.3%), followed by Morioka +13.0%, Nara +12.6% and Saitama/Omiya +12.5%; Ginza's +11.0% ranks fifth.
- Osaka's Midosuji, second by value, rose only 1.5%, and Nagoya's Meieki-dori, fourth by value, only 1.2%, placing both near the bottom of the increase ranking; 24 of the 47 cities accelerated versus the prior year and 17 decelerated.
Japan's National Tax Agency published the 2026 rosenka on 1 July. Be precise about what the release contains: one attachment, an appendix table listing the highest roadside land value in each of the 47 prefectural capital cities, with change rates for 2026 and 2025. No national average appears in the released document. All figures below come from that table.
Rosenka is the valuation basis for inheritance and gift tax, assessed as of 1 January at roughly 80% of published land price. Foreign owners passing Japanese property to heirs will have the land valued on this basis.
Across the 47 cities, 44 rose, three were flat (Aomori, Tsu, Tottori) and none fell. The prior-year column shows 35 rising, 11 flat and one falling, that one being Tottori, which moved from −3.2% to 0.0% and emptied the decline column.
The top value remains Ginza Chuo-dori at 53,360 thousand yen per square metre, up 11.0% from 48,080. The lowest, Tottori's Wakasa Kaido-dori at 91 thousand yen, sits 586 times below it.
The biggest increase is not Tokyo. Saga leads at +17.0% (from +9.3%), then Morioka +13.0%, Nara +12.6% and Omiya +12.5%. Ginza is fifth. Morioka and Shizuoka changed the location of their highest value, so their comparison carries a caveat.
At the other end, Osaka's Midosuji, second by value, rose 1.5%, and Nagoya's Meieki-dori, fourth by value, 1.2%. Owners in central Osaka and Nagoya saw their tax base barely move.
This site begins tracking this series from the current edition, updated each July.
[National Tax Agency, 'Concerning the 2026 Roadside Land Values' (July 2026) - contents of the release]
1. Summary For inheritance and gift tax, land is valued at market value. Because taxpayers cannot readily determine market value themselves when filing, the Regional Taxation Bureaus set and publish each year the roadside land values and valuation multipliers that serve as the basis for valuing land nationwide. The 2026 values were published on the agency's website on Wednesday 1 July. The site carries values from 2018 through 2026 (https://www.rosenka.nta.go.jp). The highest roadside values in the 47 prefectural capital cities are set out in the appendix table.
2. Reference notes from the release The values cover privately owned residential land, paddy, field and forest nationwide. For valuation purposes, residential land means land forming the site of a building, whether residential, commercial or industrial in use. Values are assessed as of 1 January, take account of land price movement over the year, and are set at approximately 80% of a price based on the published land price and related benchmarks. Land in areas with roadside values is valued by the roadside value method; other areas are valued by the multiplier method. Roadside value method: the value is the roadside value of the fronting route, multiplied by the necessary plot adjustment rates (correcting for depth, irregular shape, corner position and similar) and by the land area. A roadside value is the per-square-metre value assessed for each route fronted by a run of land of broadly equivalent value. Multiplier method: the value is the property tax assessed value of the land multiplied by the valuation multiplier set for areas of similar land price conditions.
3. Appendix table: highest roadside land value in each prefectural capital city, 2026 (thousand yen per square metre, year-on-year change in brackets) Sapporo 8,320 (+7.5%); Aomori 160 (+0.0%); Morioka 260 (+13.0%); Sendai 3,740 (+1.1%); Akita 150 (+3.4%); Yamagata 180 (+2.9%); Fukushima 205 (+2.5%); Mito 225 (+2.3%); Utsunomiya 350 (+2.9%); Maebashi 145 (+7.4%); Saitama (Omiya) 6,660 (+12.5%); Niigata 530 (+6.0%); Nagano 310 (+5.1%); Chiba 2,690 (+8.5%); Tokyo (Ginza) 53,360 (+11.0%); Yokohama 17,600 (+2.3%); Kofu 270 (+1.9%); Toyama 570 (+5.6%); Kanazawa 1,120 (+9.8%); Fukui 410 (+2.5%); Gifu 530 (+1.9%); Shizuoka 1,200 (+1.7%); Nagoya 13,040 (+1.2%); Tsu 195 (+0.0%); Otsu 310 (+5.1%); Kyoto 9,110 (+9.5%); Osaka 21,200 (+1.5%); Kobe 6,400 (+9.6%); Nara 980 (+12.6%); Wakayama 380 (+2.7%); Tottori 91 (+0.0%); Matsue 145 (+3.6%); Okayama 2,010 (+4.7%); Hiroshima 3,880 (+4.6%); Yamaguchi 150 (+3.4%); Tokushima 300 (+1.7%); Takamatsu 390 (+2.6%); Matsuyama 700 (+1.4%); Kochi 220 (+2.3%); Fukuoka 9,920 (+2.5%); Saga 275 (+17.0%); Nagasaki 800 (+1.3%); Kumamoto 2,140 (+1.9%); Oita 600 (+3.4%); Miyazaki 250 (+4.2%); Kagoshima 940 (+1.1%); Naha 1,660 (+6.4%).
4. Notes to the appendix table Roadside values are assessed as of 1 January each year at approximately 80% of a price based on the published land price and related benchmarks. Morioka and Shizuoka changed the location of their highest roadside value; the bracketed figure in the upper row of the table is the 2025 value at the former location, and the 2025 change rate is calculated on the new location.